NLP Data Analysis Flow Concept

Context
The case study involves the design of a platform aimed at enhancing data analysis for better comprehension. The platform is intended to enable users to feed the relevant data into the desired model for effective outcomes.
The Challenge:
Designing an effective data registration flow that allows users to fetch and upload any number of files from local devices or cloud sources. The main challenge is to provide a seamless experience for users to upload and fetch multiple files, without overwhelming them with too many options or steps.
Once the data files are available, the challenge is to enable users to view a snapshot of the fetched or uploaded files in a clear and easy-to-understand way. This requires providing an interface that is similar to an excel sheet view, making it easy for users to look through the data inside each of the files uploaded.
The next challenge is to enable users to choose the type of analysis they want to perform on the dataset. The analysis types include Unigram analysis, Bigram analysis, Trigram analysis, Quadgram analysis, Topic Model LDA, Topic Distribution, Rake Keywords, Noun chunks, and Sentiment. Enabling users to select multiple analyzers to process the dataset in a user-friendly way without overwhelming them with too many options is essential to providing a great user experience.
Mind Mapping
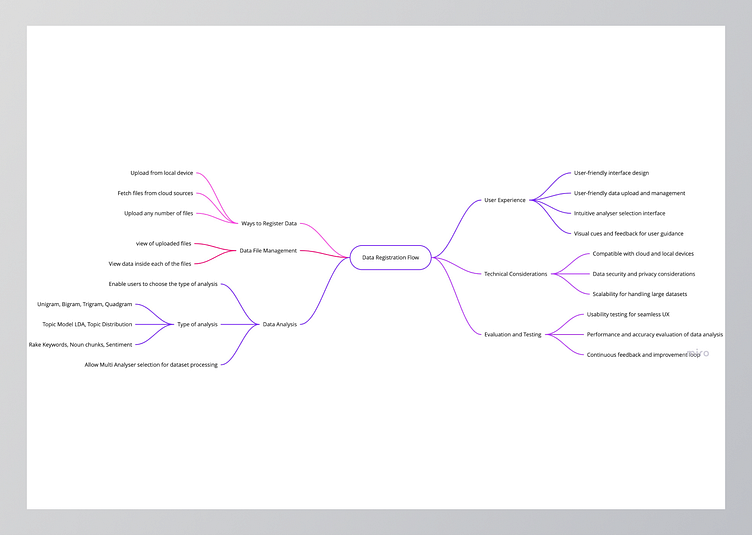
The central topic is the Data Registration Flow. The goal of this flow is to enable users to easily register their data and analyze it for better understanding.
The first step in the Data Registration Flow is to provide users with two options for registering their data. They can either upload multiple data files from their local device or fetch data files from cloud sources like AWS, S3, or Azure. The main challenge here is to enable users to fetch and/or upload any number of files.
The second step in the Data Registration Flow is to provide users with a way to manage their data files. Once the data files are available, users should be able to see a snapshot view of those fetched/uploaded files, similar to an Excel sheet view. The challenge here is to allow users to look through the data inside each of the files uploaded, making it easy for them to find the data they need.
The third and final step in the Data Registration Flow is to provide users with a way to choose the type of analysis they want to perform on the dataset. There are three types of analysis, each with their own subtypes. The main challenge here is to allow users to select multiple analyzers to process the dataset.
To ensure a seamless user experience, the UX design of the Data Registration Flow should include a user-friendly interface that is easy to use. Visual cues and feedback should be provided to guide users through the process. Technical considerations like compatibility with various cloud sources and local devices, data security, and scalability should also be taken into account.
Finally, usability testing should be conducted to ensure a seamless user experience. Performance and accuracy of data analysis should also be evaluated and improvements made based on feedback from users.
The Output
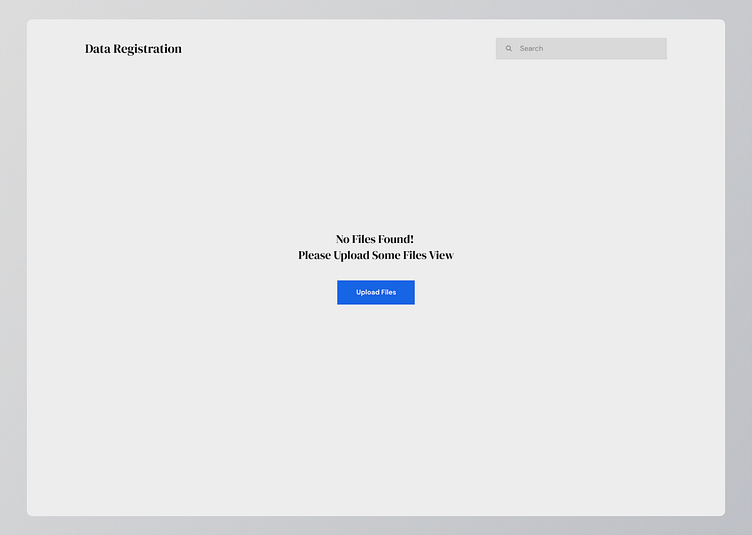
In the absence of files on the platform, the user will be presented with a blank screen and an option to upload.
When a user is onboarded, he or she may upload any number of files from their local device or from cloud sources to the system. To finish the process, users may do one of the following.
Upload multiple files from their local device
Fetch files from cloud sources
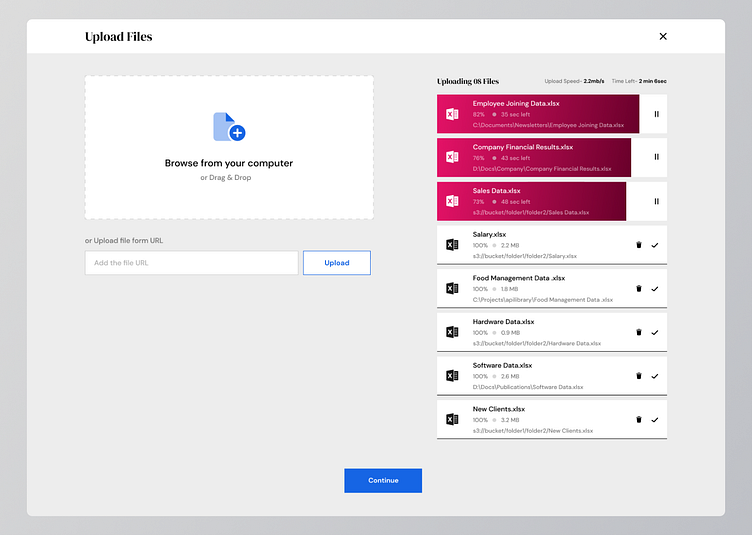
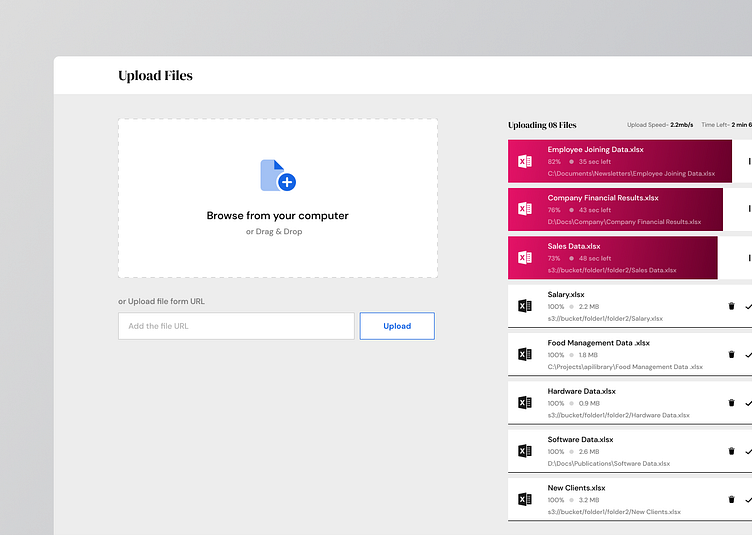
On the aforementioned screen, the user has the ability to upload files either from their local device or from the cloud. On the right side of the screen, there are indications of the uploading files, including the number of files, upload speed, and time, as these are the part of the system feedback.
The top three cards display the progress of the uploads, offering the options to pause and resume, while the remaining cards show already uploaded files. The user also has the option to delete these uploaded files.
There are a number of other scenarios outlined below-
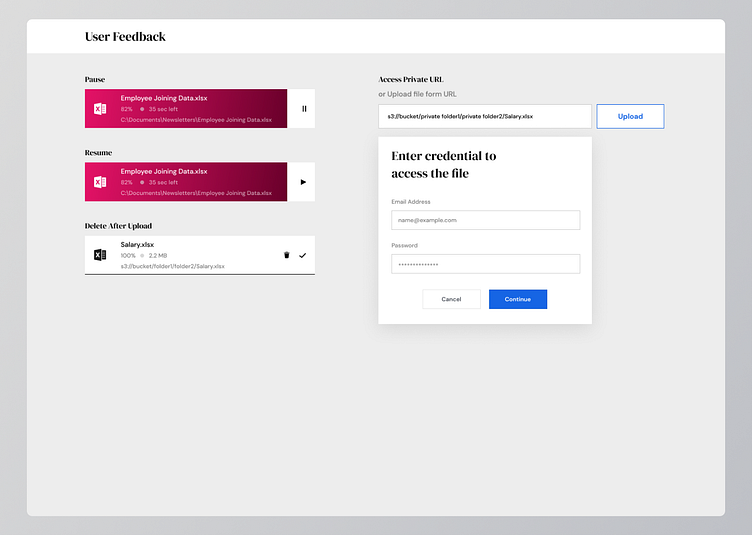
1. User Feedback
The purpose of this screen is to manage different cases related to uploading files. The features available include:
Pausing and resuming uploading files in progress.
The ability to delete the file once the upload is complete.
Fetching files from the cloud, including private files that may require credentials to access.
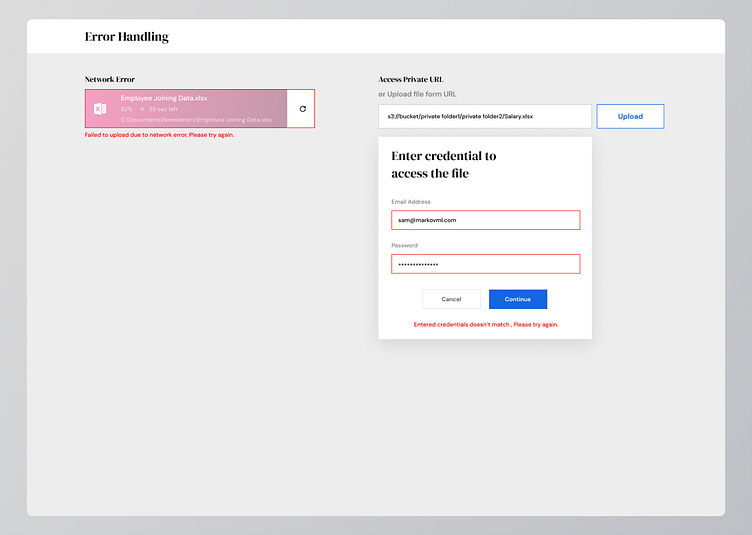
2. Error
Errors may occur during the upload process, but they are also handled in this screen. These errors include:
Network errors causing uploads to become stuck, giving the user the option to re-upload the file.
If the credentials don't match while accessing a private file, the user will be notify.
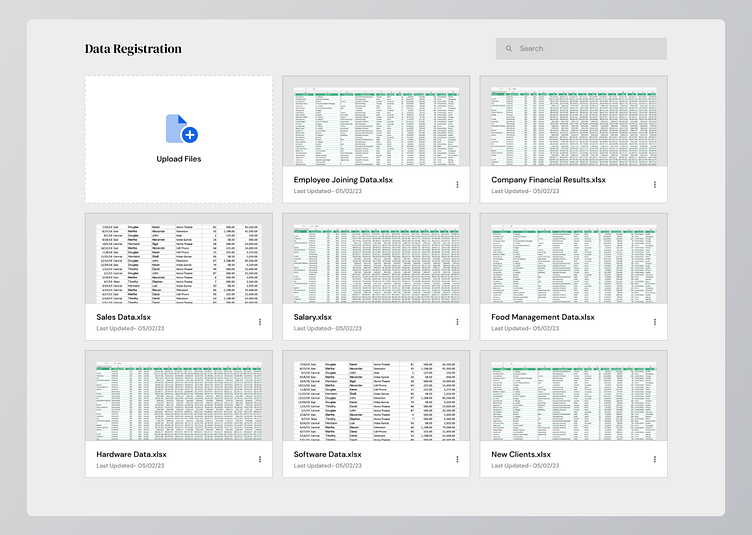
Document Viewer
Once the files have been uploaded, the user can view and manage them from this screen. The user has the option to view the details of any file by double-clicking on it. Additionally, the user has the ability to upload more files by clicking the "Upload File" card.
Detail View
This screen contains valuable data about a file. The user can view all the data and validate it here, as well as apply filters, search using keywords, and perform analysis.
Of all the features, performing analysis is the most critical. The user can initiate analysis by clicking the "Analysis" button.

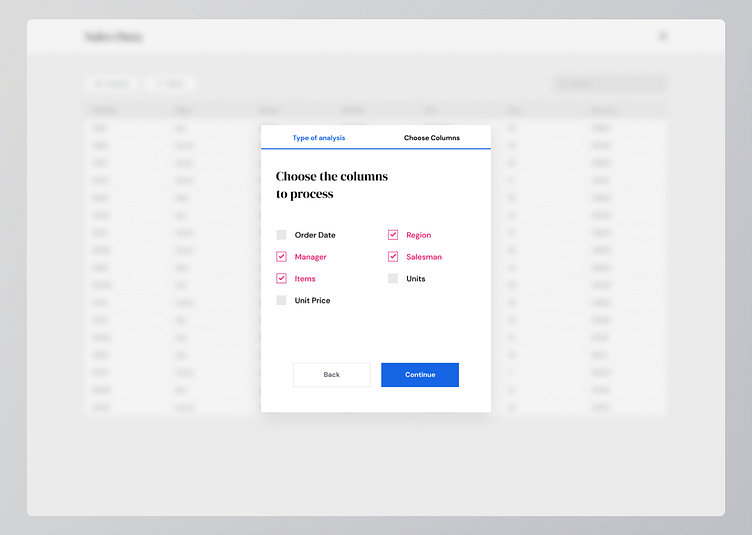
Analysis
When the user clicks the "Analysis" button, a modal will appear displaying details. The user needs to first select the type(s) of analysis to be performed, which can be one or multiple.
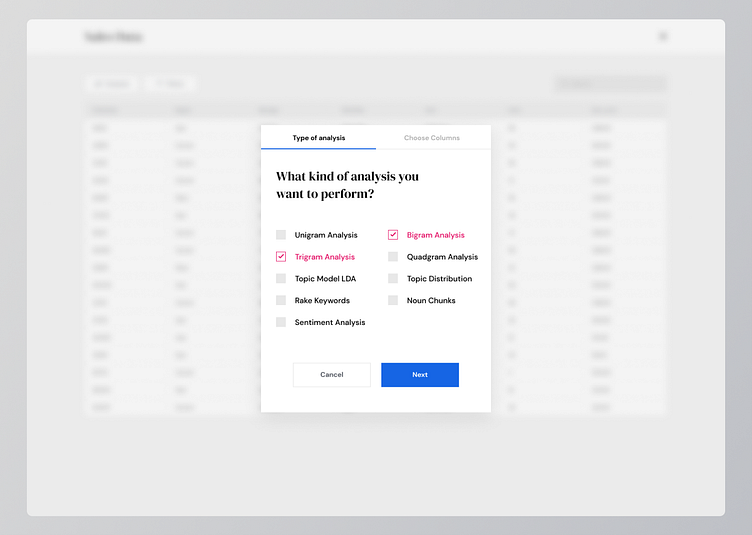
Once the user has chosen the type(s) of analysis, they must also select the columns of the table to be analyzed. The multiple select option provides the user with flexibility in performing the analysis.
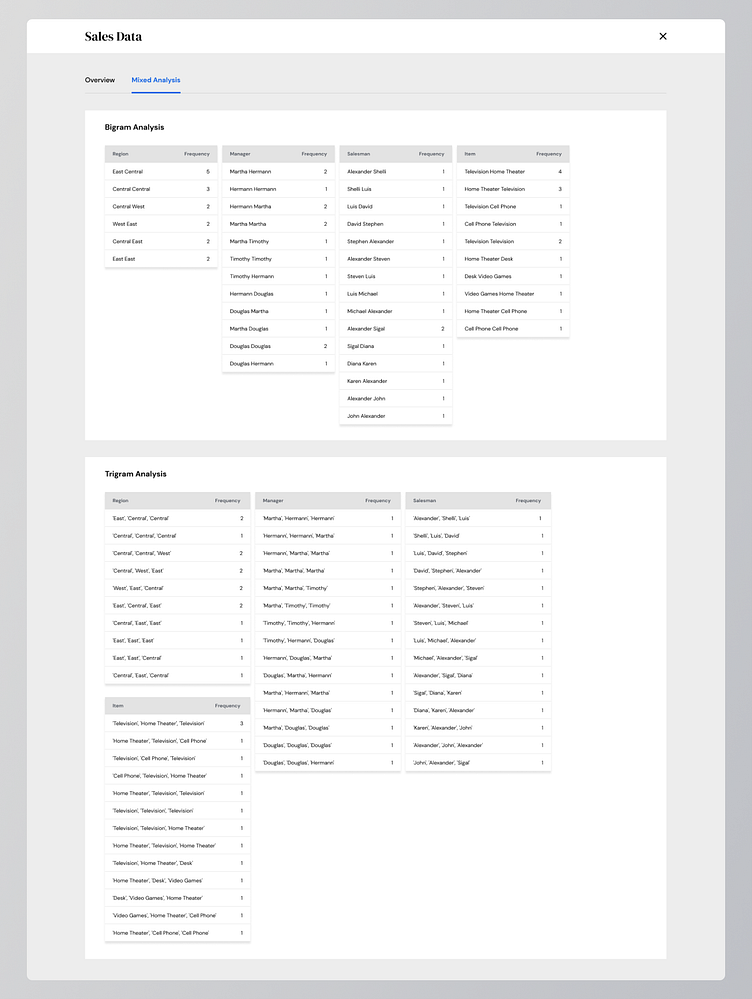
Analysis Result
Once the data has been analysed based on the inputs, User will land to this particular screen which contains the all the possible outcome of the analysis.
For example- User wanted to perform the Bigram & Trigram analysis on the Region, Manager, Sales & Item column. In this screen user has 2 different section for Bigram & Trigram Analysis.
User has the clear view of the data the column he/she has chosen and the data is categorised in the same way.
___________________________
If you enjoyed this project, be sure to follow my website for updates on my latest work. You can also find more of my writing and design insights on my Medium page.
Find me on Web- www.hellosam.in
Connect on Linkedin- @samuxdesigner
Follow me on Medium- @imsam


