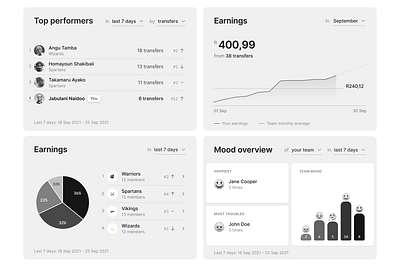
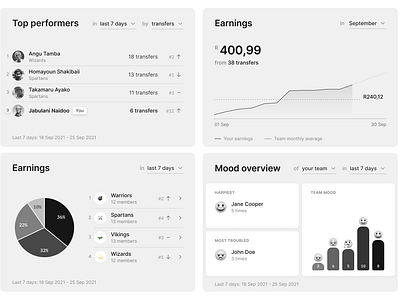
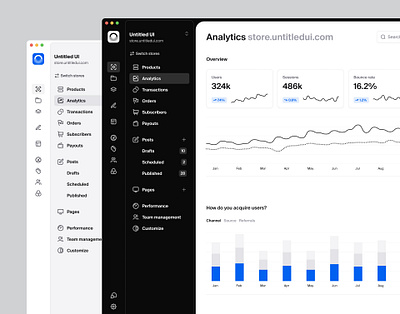
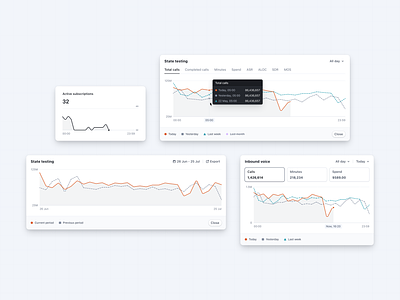
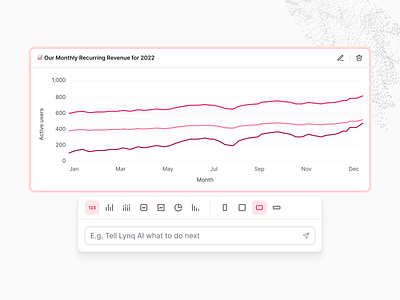
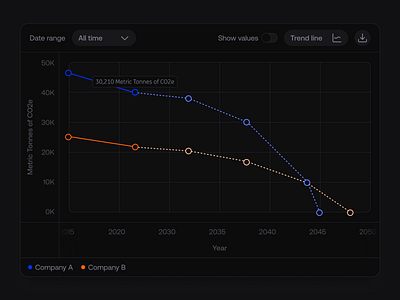
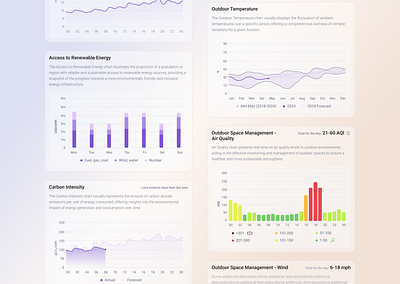
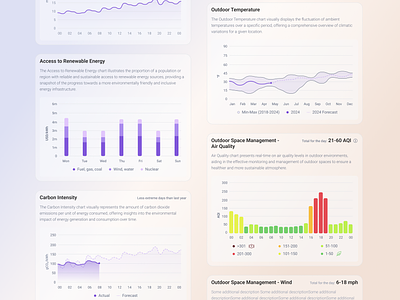
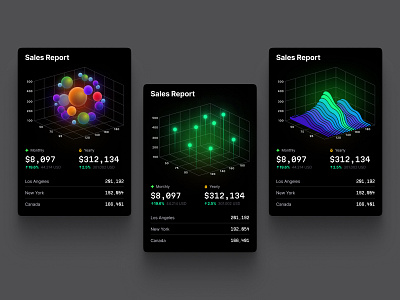
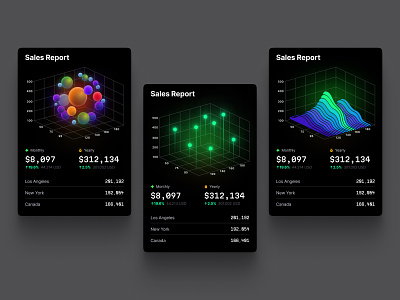
Line Chart

994 inspirational designs, illustrations, and graphic elements from the world’s best designers.
Want more inspiration? Browse our search results...

  1. Home Budget - concept fintech app account balance dark mode data visualization details expenses fintech graph home screen homebudget ios line chart mobile app money pie chart savings scatter chart scatter graph tabbar user interface wallet
    View Home Budget - concept fintech app
    Home Budget - concept fintech app
    7
    1.1k
  2. 🧑🏻‍🍳 Foodiefare • Recipe List & Insights app bar chart bar chart line design dropdown empty state food hover insight insights line chart list pie chart rate rating recipe ui ux web app
    1
    View 🧑🏻‍🍳 Foodiefare • Recipe List & Insights
    🧑🏻‍🍳 Foodiefare • Recipe List & Insights
    72
    5.4k
  3. Donation Profile • AlignUI Design System card chart dashboard design design system donation donation profile financial line chart statistic typography ui ux
    View Donation Profile • AlignUI Design System
    Donation Profile • AlignUI Design System
    644
    130k
  4. Dashboard Widgets bar chart chart dashboard line chart mood board performance pie chart user experience ux wf widget wireframe
    View Dashboard Widgets
    Dashboard Widgets
    2
    1k
  5. Widget Exploration banking bar chart component design expanse finance financial fintech line chart management minimal money product design saas saas tool saving wallet web webapp widget
    View Widget Exploration
    Widget Exploration
    6
    3.1k
  6. Skillsphere: E-Course Dashboard Saas Web App - Exam Quiz 📚 chart component dashboard data visualization ecourse elearning exam form input form leader board learning line chart product design quiz saas timer ui component uiux web app web design
    View Skillsphere: E-Course Dashboard Saas Web App - Exam Quiz 📚
    Skillsphere: E-Course Dashboard Saas Web App - Exam Quiz 📚
    86
    3.9k
  7. Web analytics dashboard — Untitled UI analytics chart dashboard google analytics line chart line graph nav navigation product design sidenav ui ui design user interface web analytics
    View Web analytics dashboard — Untitled UI
    Web analytics dashboard — Untitled UI
    137
    23.8k
  8. Invoice Tracker - Line Chart Animation (Dark) chart animation figma animation fintech fintech graph graph animation invoice design invoice tracker line chart line graph
    View Invoice Tracker - Line Chart Animation (Dark)
    Invoice Tracker - Line Chart Animation (Dark)
    1
    4.3k
  9. Sominu - Analytics Dashboard analytics chart data ecommerce graph insights line chart list management overview product design report reports saas sales statistics stats ui ux
    1
    View Sominu - Analytics Dashboard
    Sominu - Analytics Dashboard
    137
    37.8k
  10. 📈 Line Charts charts components design system graphs line chart product design statistics ui design ux design web app
    View 📈 Line Charts
    📈 Line Charts
    35
    11.2k
  11. Chart bar command menu ai apollo bar chart chart chart ai chart customization chart size chart type chart ui chatgpt command menu crm customisation dashboard funnel line chart open ai pie chart saas salesforce
    View Chart bar command menu
    Chart bar command menu
    22
    18.4k
  12. Crypto-analytical Dashboard admin banking dashboard crypto crypto dashboard dark theme dashboard defi app desktop desktop design exchange fintech line chart panel platform saas staking ui design user interface web design web design inspiration
    View Crypto-analytical Dashboard
    Crypto-analytical Dashboard
    228
    27.3k
  13. Data Visualisation Exploration auto layout bar chart chart dashboard data visualisation digital figma insight line chart x matrix
    View Data Visualisation Exploration
    Data Visualisation Exploration
    5
    5.8k
  14. Environmental Charts Design | Line chart | Bar Chart analytics bar chart chart design charts clean air climate monitoring concept dailyui dashboard data data visualization design eco environmental charts infographics inspiration line chart naturemetrics statistic ui
    View Environmental Charts Design | Line chart | Bar Chart
    Environmental Charts Design | Line chart | Bar Chart
    10
    3.8k
  15. #Exploration - Financial Dashboard bar chart cards charts clean dark mode dashboard data doughnut chart financial illustrations layout line chart list pie chart stats thumbnail transaction ui ux whitespace
    View #Exploration - Financial Dashboard
    #Exploration - Financial Dashboard
    129
    13.6k
  16. Runmoon - Solar Panel Monitoring App android apps chart clean dashboard design energy home ios line chart mobile app mobile ui monitoring onboarding panel solar solar panel ui ux uidesign uiux
    View Runmoon - Solar Panel Monitoring App
    Runmoon - Solar Panel Monitoring App
    390
    41.6k
  17. Subscriptions charts clean clean ui dark dark design dark mode dashboard ecommerce ecommerce app line chart minimal saas shopping shopping app subscriptions tables
    View Subscriptions
    Subscriptions
    255
    144k
  18. Miyarsa - Podcaster Analytic Dasboard analytic analytics broadcast broadcaster chart dashboard diagram graph influencer line chart performance platform podcast podcaster radio statistics ui design uiuxdesign web apps website
    View Miyarsa - Podcaster Analytic Dasboard
    Miyarsa - Podcaster Analytic Dasboard
    319
    70.2k
  19. Chart Library - Free 90+ Charts UI KIT analytics area chart bar chart chart library crm data visualization donut chart dual axis chart figma free freebies graph line chart saas sales statistics ui ui kit ux waterfall chart
    1
    View Chart Library - Free 90+ Charts UI KIT
    Chart Library - Free 90+ Charts UI KIT
    371
    48.7k
  20. Optio: Charts app bar graph cap table chart charts equity finance fintech line line chart optio percentages pie chart product design properly ui ux value waterfall
    View Optio: Charts
    Optio: Charts
    191
    94.9k
  21. BLOG - Dynamic Business Through Analytics analytics bar chart blocks blog blog cover blog header building chart charts city data digital illustration editorial illustration line chart skyscraper social vizlib
    View BLOG - Dynamic Business Through Analytics
    BLOG - Dynamic Business Through Analytics
    9
    1.6k
  22. eCommerce Analytics Dashboard analytics analytics dashboard app design chart dashboard data datepicker deskop app ecommerce ecommerce analytics figma icon set icons line chart pie chart side menu store store analytics ui user inferface
    View eCommerce Analytics Dashboard
    eCommerce Analytics Dashboard
    28
    21.7k
  23. NEW PRODUCT ✦ Hyper charts UI Kit 3d chart analytics bar chart chart circle chart components dashboard data dataviz desktop heatmap infographic line chart neon pie chart sankey statistic template ui widgets
    View NEW PRODUCT ✦ Hyper charts UI Kit
    NEW PRODUCT ✦ Hyper charts UI Kit
    227
    54.1k
  24. Maqna - Health Tracker Dashboard analytics animation charts component dashboard data design dipa inhouse graphs health interaction design line chart metrics product product design statistics stats track ui design web app
    View Maqna - Health Tracker Dashboard
    Maqna - Health Tracker Dashboard
    170
    25.1k
Loading more…