1. Style proposal for explainer video animation building design explainer video illustration storytelling visual communication
    View Style proposal for explainer video
    Style proposal for explainer video
  2. Style proposal for explainer video animation coin design explainer video finance illustration information design money storytelling
    View Style proposal for explainer video
    Style proposal for explainer video
  3. Style proposal for explainer video animation explainer video illustration lab research scientist storytelling visual communication
    View Style proposal for explainer video
    Style proposal for explainer video
  4. Trim, trim, trim editing essential infographic information design informationdesignersnotebook scissors storytelling visual communication
    View Trim, trim, trim
    Trim, trim, trim
  5. Not too abstract, not too realistic, just right abstract burger drawing hamburger hamburger icon hamburger menu illustration infographic information design informationdesignersnotebook pictogram realistic storytelling visual communication
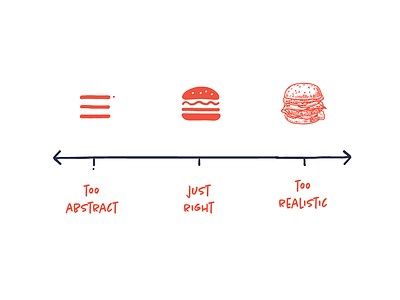
    View Not too abstract, not too realistic, just right
    Not too abstract, not too realistic, just right
  6. Tell the story differently for different media animation infographic information design informationdesignersnotebook poster slideshow social media storytelling visual communication
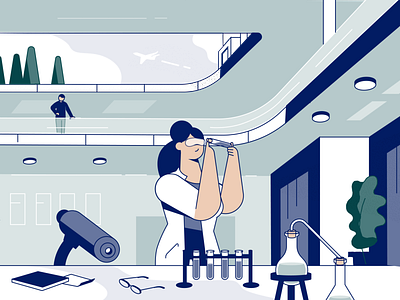
    View Tell the story differently for different media
    Tell the story differently for different media
  7. Always Ask: “Is there a clearer way to do it?” arrows infographic information design informationdesignersnotebook sign storytelling visual communication
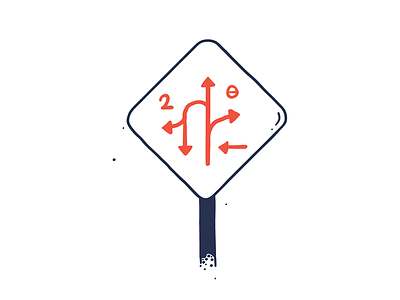
    View Always Ask: “Is there a clearer way to do it?”
    Always Ask: “Is there a clearer way to do it?”
  8. Put numbers in context. Always. animation bar chart data visualisation data visualization infographic information design informationdesignersnotebook storytelling
    View Put numbers in context. Always.
    Put numbers in context. Always.
  9. Love your spreadsheets data analysis data visualisation data visulization excel heart infographic information design informationdesignersnotebook love numbers spreadsheets storytelling
    View Love your spreadsheets
    Love your spreadsheets
  10. Design and writing are intertwined communication copywriting infographic information design informationdesignersnotebook pencil plane storytelling words
    View Design and writing are intertwined
    Design and writing are intertwined
  11. Information design is multidisciplinary copywriter copywriting designers developers illustration infographic information design informationdesignersnotebook motiondesigners projectmanagement storytelling
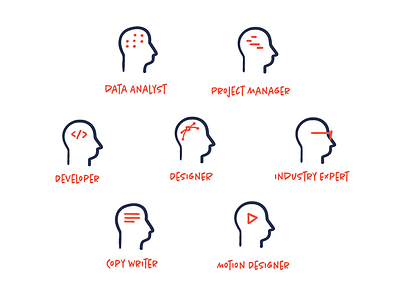
    View Information design is multidisciplinary
    Information design is multidisciplinary
  12. The design process is not generic agile design process infographic information design informationdesignersnotebook process storytelling
    View The design process is not generic
    The design process is not generic
  13. Don’t design for designers. Design for people. audience designer infographic information design informationdesignersnotebook storytelling
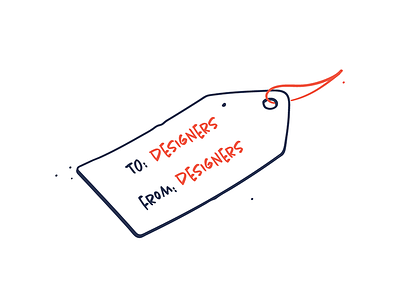
    View Don’t design for designers. Design for people.
    Don’t design for designers. Design for people.
  14. Don’t reinvent the wheel animation bicycle icon illustration infographic information design informationdesignersnotebook storytelling triangle wheel
    View Don’t reinvent the wheel
    Don’t reinvent the wheel
  15. Invest in sketching infographic information design informationdesignersnotebook pencil sketch sketching storytelling
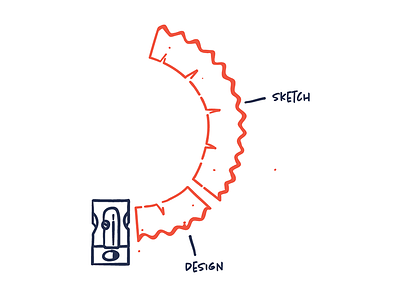
    View Invest in sketching
    Invest in sketching
  16. Screen your content for visual potential cactus cheese content infographic information design informationdesignersnotebook pyramid storytelling
    View Screen your content for visual potential
    Screen your content for visual potential
  17. Format follows story infographic information design informationdesignersnotebook storytelling
    View Format follows story
    Format follows story
  18. Find the infographic sweet spot infographic information design informationdesignersnotebook storytelling venn diagram
    View Find the infographic sweet spot
    Find the infographic sweet spot
  19. If you can’t explain it simply, you don’t understand it albert einstein e=mc² infographic information design informationdesignersnotebook storytelling
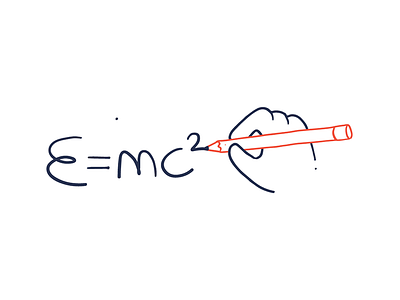
    View If you can’t explain it simply, you don’t understand it
    If you can’t explain it simply, you don’t understand it
  20. Simply figure out what to tell and how to tell it infographic information design informationdesignersnotebook storytelling
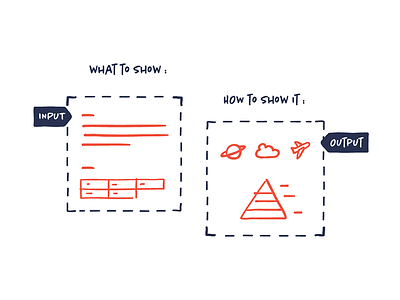
    View Simply figure out what to tell and how to tell it
    Simply figure out what to tell and how to tell it
  21. Always define a goal infographic information design informationdesignersnotebook storytelling
    View Always define a goal
    Always define a goal
  22. The Information Designer’s Notebook infographic information design informationdesignersnotebook notebook storytelling
    View The Information Designer’s Notebook
    The Information Designer’s Notebook
  23. Hi! animation basketball debut illustration
    View Hi!
    Hi!
Loading more…