26 Weeks

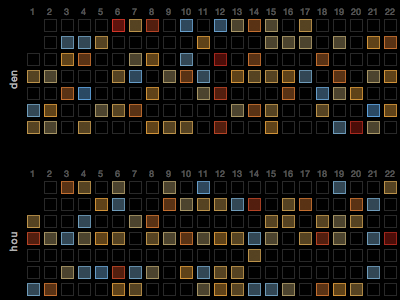
A visualization experiment using d3.js. A heatmap that can be used to measure any one statistic amongst one or more NBA teams. Each column represents one week in the NBA and each square represents one calendar day. The black squares indicate there wasn't a game that particular day.


