Activity App Analytics


Hello all!
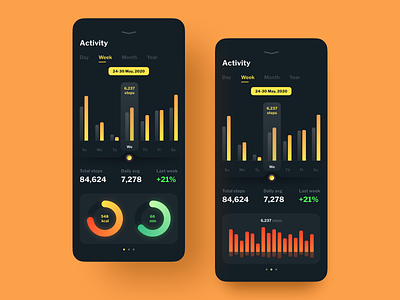
Data visualization makes information more apprehensive and simpler. Data delivered in graphic form is easier to analyze, compare, and refer to in stories.
That’s why today we’d like to present a concept of an Activity App, designed to track and show users’ health and wellbeing parameters💪
What do you think? Leave your likes and comments below this post. And do not forget to check our previous shots on Behance
Made with ❤️ at Uptech.


