


Key visual of a Data Visualization exhibition

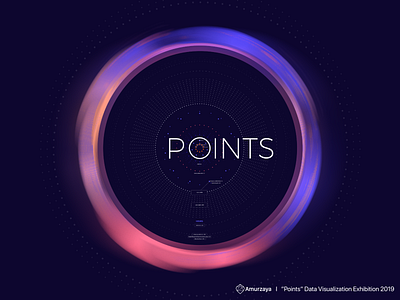
"Points" Data Visualization Exhibition 2019
It was a school project that organized and participated in by students of the Institute of Creative Industries Design, NCKU.
Every "point" has a point. The poster itself a data visualization. This circle includes numbers of projects, data length, our team members, teachers, audiences, time that we consumed, night hours that we didn't sleep, etc.


