Bullet Chart

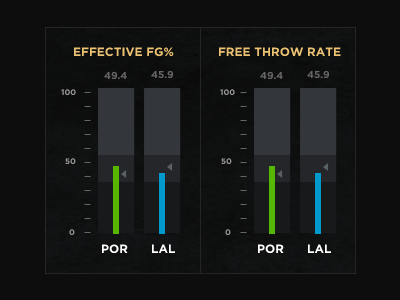
Experimenting with bullet charts. They're a great alternative to plain bar charts because they can encode 3 values in a compact view. They work especially well for metrics where the user might not be familiar with the measurement.
The 3 shaded areas behind the colored bars can represent bad, good, and best. The colored bars represents the actual measurement and the triangle represents the average (season avg. in this instance). More info on Wikipedia - http://en.wikipedia.org/wiki/Bullet_graph
Oh yeah, BEAT L.A.!


