Color Assignment for Two-Level Donut Data Visualization

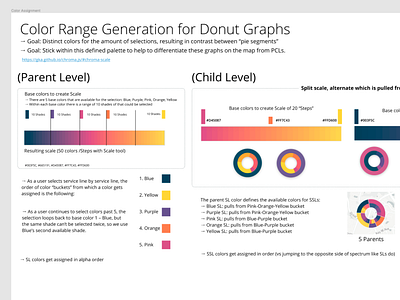
Figma artboard displaying the explanation for implementation. Using chroma.js - based color palette helper, defining the order and way in which colors will assign to our map markers which show the distribution of parent/child categories on a map based on user-selected parent and/or child category selections. This is just a sneak peek into the deliverable for a whole new feature on our platform. It's been a lot of work to get here, considering many other factors including: other data layers which can be present on the map at the same time, the actual data behind this visualization, the size of these and other markers, as well as a content panel which scales up this marker into an interactive graphic with clickable segments. We even have a design that considers what happens when these markers become "clustered" per location, so users can choose a "less noisy" map to wayfind and then dig deeper.


