Area Range with Trendline

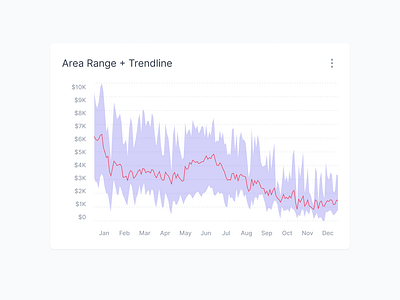
An area range chart with a trendline. This visualization is used to show how the delta or difference between two values changes over time.
Learn more here:
https://www.designencyclopedia.io/element/area-range-trendline
An area range chart with a trendline. This visualization is used to show how the delta or difference between two values changes over time.
Learn more here:
https://www.designencyclopedia.io/element/area-range-trendline


