Hierarchy Visualization

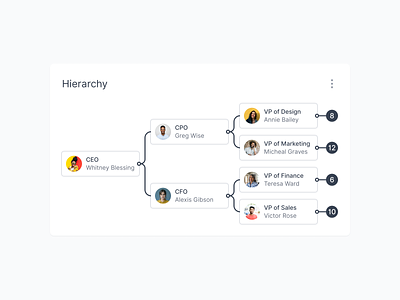
This visualization is used to portray the elements of a system, organization, or concept from its highest position to the lowest. Connecting lines explain the relationship between different objects.
Learn more here:
https://www.designencyclopedia.io/element/hierarchy


