Lots of Charts

Click to view full res!
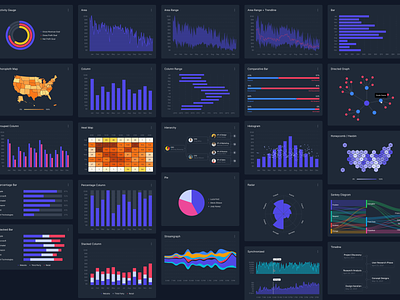
We build lots of dashboards, report builders, and executive summaries at Innovatemap, so I've been working on a comprehensive collection of charts, graphs, and visualizations.
Learn more here:
https://www.designencyclopedia.io/category/visualization
You can sample the file here:
https://www.figma.com/community/file/967439551399612926/Charts%2C-Graphs%2C-and-Visualizations


