Data Visualization | Dark Theme UI


⚫ DARK THEME ⚫
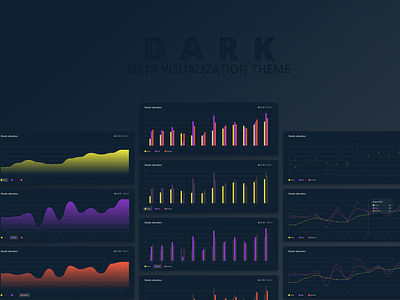
Creating dark and light themes always seems to present a challenge. The palette you believe will work for both suddenly becomes lost in either theme. Creating these data vis tables was a good exercise in choosing colors that work well together and still manage to convey the important information.
---------
Find me on:
Instagram | Twitter | Behance | LinkedIn | Uplabs


