Covid healthcare dataviz interaction detail

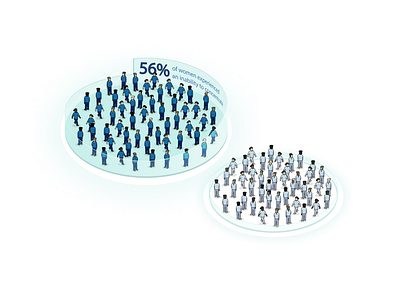
Data manipulation condensing 67,000 results as a percentage. Each question can be filtered by demographic. The people walk inbetween circles to demonstrate whether the people show a positive or negative reaction to the relevant question / filter.


