Creating a Technology Page for a Medical Care Startup


Creating a data-rich technology page that is also accessible and engaging is a major challenge for any web designer. Luckily, at Zajno, we’ve had a bit of experience in this department!
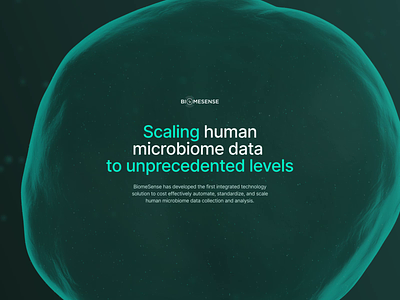
The Biomsense project, which collects and analyzes a large amount of data from a biosensor, is a good illustration. Our task was to present this data in just a limited part of the page – no easy task given its complexity. We eventually settled on visualising the totality of the data as a ‘universe’, which is then broken down into successively smaller parts, which we might figuratively refer to as galaxies, solar systems, and so on. This represents the way in which the technology is able to take a great body of data and divide it into distinct areas for analysis.
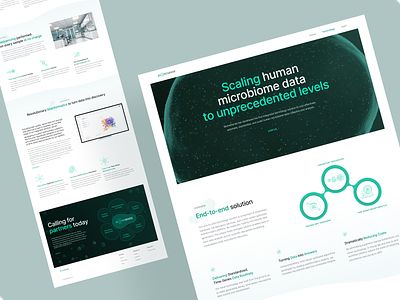
As the whole purpose of the visual content is to help make the concepts clearer and more accessible, it was crucial that these visuals did not get in the way of the text – which is also doing just the same job, but in a different way. In the end, we were pleased with the way text and visuals were able to complement each other.
I created the page design in Figma, with Bogdan producing the 3D visuals in Cinema 4d.
Which of your design products have given you a satisfying sense of balance? Please share your experience in the comment section.
P.S. Many thanks to Igor and Bogdan, who created the loop animation in the main visuals.
Website | Join our Newsletter! | Crappy Explanation Playlists App | TheGrid | Spotify | Twitter | Medium | Facebook | Instagram