Visualizing S&P 500 Index Performance by Company

Visualizing S&P 500 Index Performance by Company
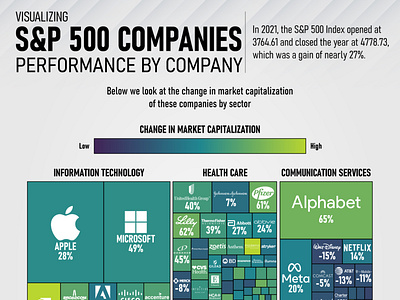
Towards the end of 2021, the S&P 500 index marked its 70th record finish. Looking at the number of record highs, 2021 was truly remarkable—33 in 2020, 35 in 2019, and the average over the 10 years from 2011 to 2020 is 28. 70 record highs was the most since 1995 when 77 S&P 500 companies achieved record closes.
At the end of 2021, the S&P 500 index was up nearly 27% and the Energy sector was one of the biggest gainers as we saw in our previous infographic “Visualizing S&P 500 Companies Performance by Sector.” But which companies did well? And which companies fell short?
Visit InsightsArtist.com for the full article and infographic.


