Color for Data Visualization

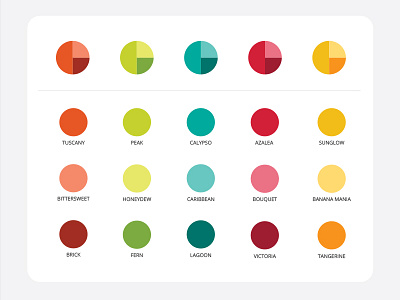

Working on a color palette for a product dashboard.
This palette is optimized for data, i.e. using a limited set of base hues and building tints and shades from these hues, creating a harmonious palette similar in value and saturations. While the color palette will provide a harmonious foundation for data visualization, it will also serve as a palette for the entire product design.


