E-learning Dashboard - Analytics


Hi! 👋
Today I want to share the second part of my recent dashboard exploration.
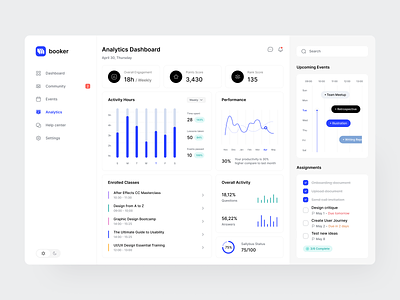
The dashboard is divided into several sections:
Activity hours: A bar graph shows the hours spent on activities for each day of the week.
Performance: A line graph tracks the user's performance over time, with a note indicating a 30% productivity increase from the last month.
Enrolled classes: A list of the classes or courses the user is enrolled in, with scheduled times.
Overall activity: Displays the percentage of questions asked and answers given, and a syllabus status bar indicating progress in course material.
With this dashboard students can track their progress, prioritise assignments and upcoming events, as well as track overall activity.
Follow us on Twitter & Facebook & Instagram.
You’re always welcome to visit our amazing Blog.


