Data visualization

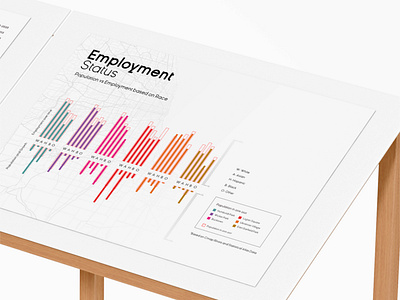
Even complex data isn't boring if you can visualize it properly. We visualized the crime rate, employment status, and purchasing ability of 6 neighborhoods in Chicago to compare and find the best place for real estate investment.


