From Dots to Data


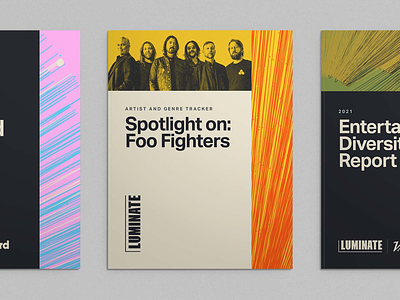

We set out in search of “what data looks like.” A true large-scale data visualization is powerful: tons of information made easily digestible, visually. Boiled down to its essence, data visualization is a series of dots and lines. So naturally, we explored this within the brand palette.
Higher contrast versions can draw the eye or create visual intrigue. Lower contrast, more monochromatic versions can be created for more of a textural element.
Check out the case study at focuslab.agency/work/luminate
---
Looking for a brand agency? We would love to hear from you.
Email us: hello@focuslabllc.com


