Voting Data Visualizations

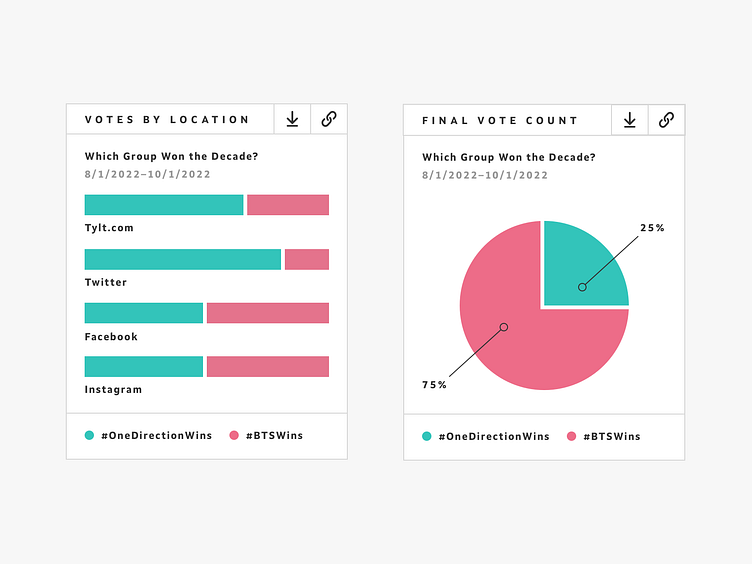
People want to know what's going on. Data visualizations help paint a more well rounded picture, bringing transparency to the conversation.
People want to know what's going on. Data visualizations help paint a more well rounded picture, bringing transparency to the conversation.


