Exploration of the charts & widgets for data visualization

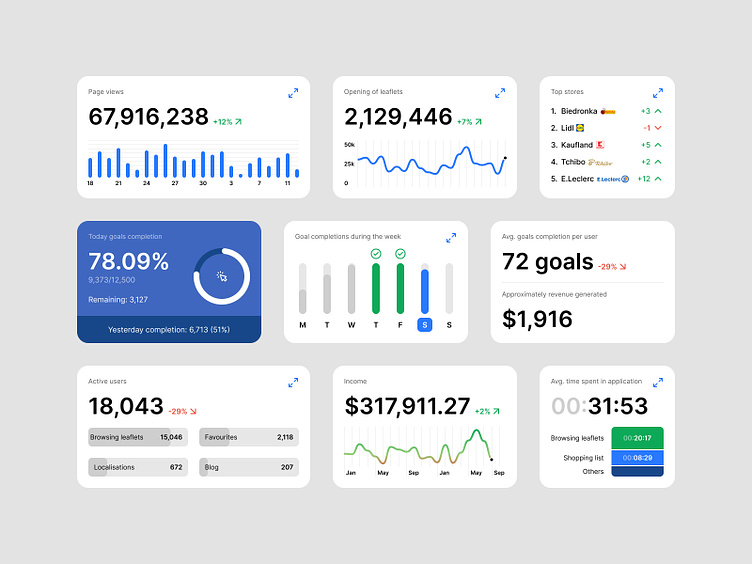
Showcase of an exploration of charts & widgets designed for data visualization.
The widgets include various chart types such as bar, line, and pie charts, each displaying data in a clear and concise manner.
The design features a clean and modern look with a focus on simplicity and usability. The charts are fully customizable, making them suitable for a wide range of applications and industries. Explore this shot for inspiration on how to create effective charts and graphs for your data visualization needs.


