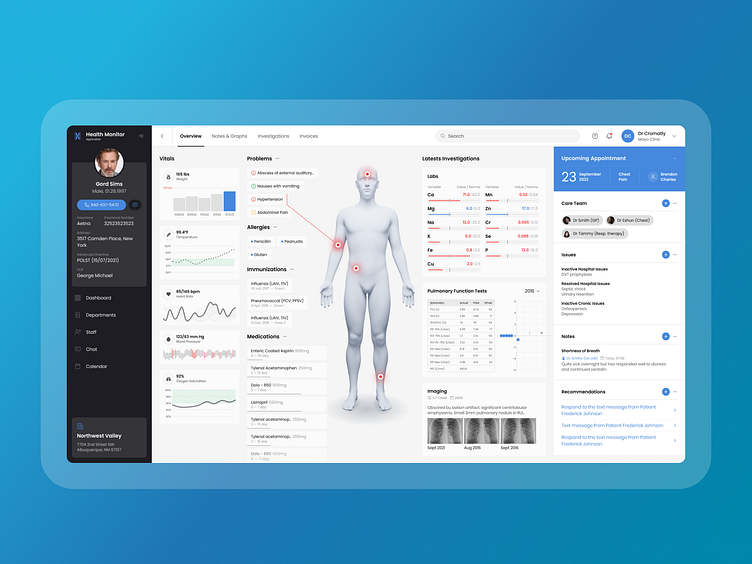
DataViz – Data visualization for a health dashboard

Hello Dribbblers!
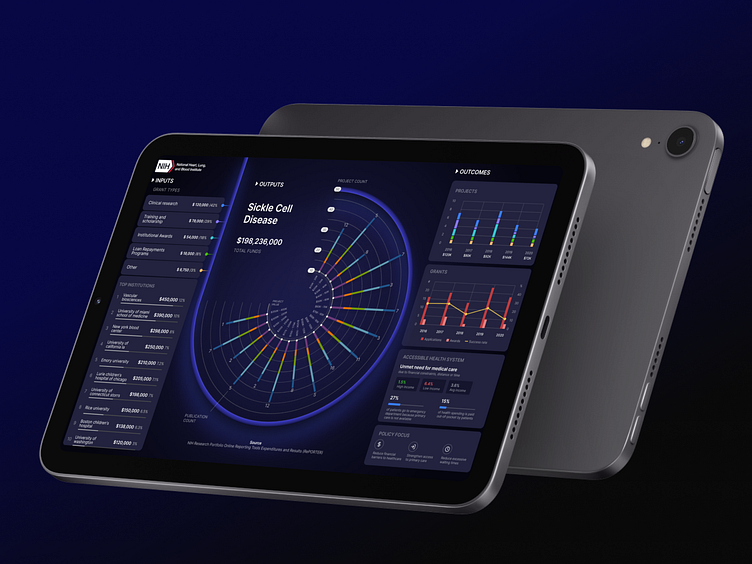
Data visualization is the display of information and analytics in a form that makes it easier and faster for the user to explore healthy information. Data is presented as graphs, charts, maps, and dashboards.
In this case, I chose a more classical data visualization approach.
I am open to new projects
Your feedback and appreciation are always welcome.