Discovery Flow Diagram

In Verdi we help users understand what ideas and opportunities are working or not working and where people are getting stuck.
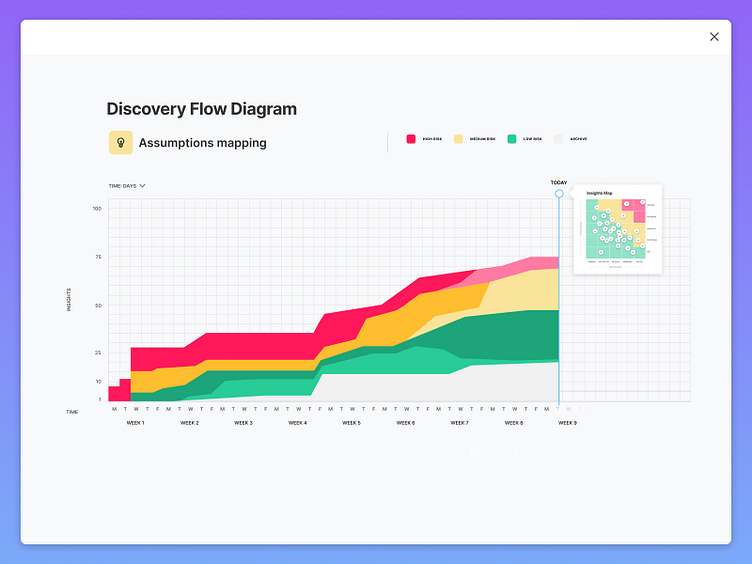
A Cumulative Flow Diagram (CFD) is an area chart that shows the various statuses of work items for an application, version, or sprint. The horizontal x-axis in a CFD indicates time, and the vertical y-axis indicates cards (issues). Each colored area of the chart equates to a workflow status (i.e. a column on your board).
The CFD can be useful for identifying bottlenecks. If your chart contains an area that is widening vertically over time, the column that equates to the widening area will generally be a bottleneck.


