Tide Predictions Infographic

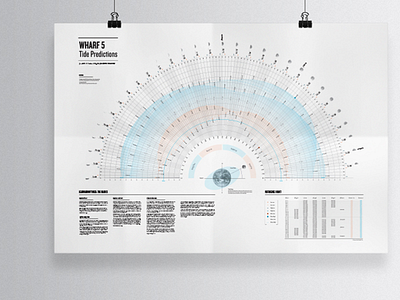

The Tide Prediction Infographic charts the Redwood City Wharf 5 tide shifts for the entire month of June 2013. The graph provides visitors and residents to/of the Bay Area information concerning the tidal heights and time of day, as well as further contextual information. The information is easily accessible in both macro/micro views.


