Logistic Dashboard, Graphs & Charts, E-commerce

Hii Dribbblers,
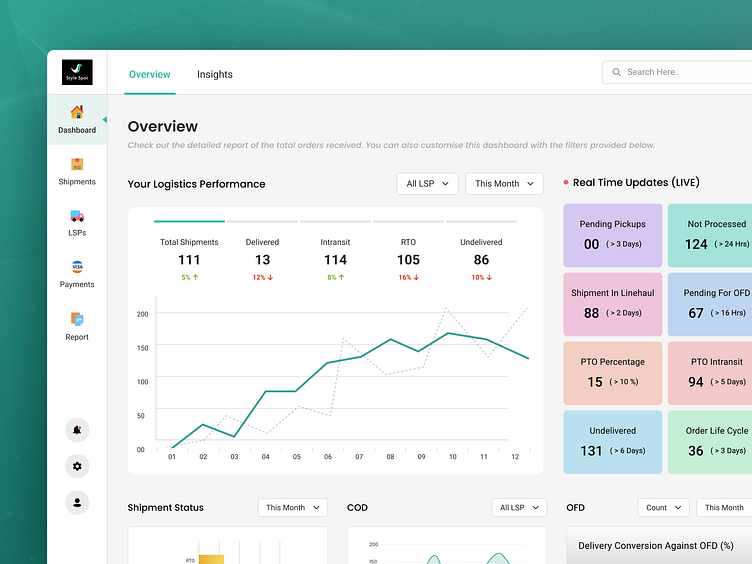
We are back again with the shot of an e-commerce application.
In this shot, we want to show you the graphical representation of the logistical performance of the platform.
Our aim was to make the dashboard interactive and easily understandable so, we used colours to depict the data.
We also provided filter options for customisation and a better user experience.
What are your thoughts?
We are available for new projects!
We are experts in:
Feel free to reach out to us at: business@octet.design
For more - Look at us onOctet Design Studio


