CRM Dashboard, Graphs and Charts

Hello dribbblers,
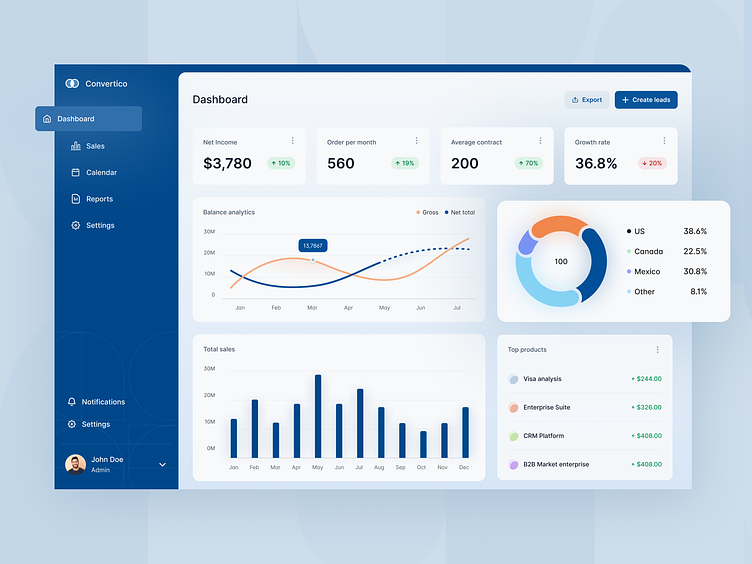
Sharing with you the last shot of our CRM Platform series.
We created a sales dashboard screen by using colourful charts and graphs to make it understandable and visually appealing.
What are your thoughts on this design?
Also, read our latest blog on-
What do UI UX Designers do? What should they deliver?
We are available for new projects!
We are experts in:
Feel free to reach out to us at: business@octet.design
For more - Look at us on Octet Design Studio
Follow us on: LinkedIn | Behance | Instagram | Twitter | Medium


