Universal Data Visualization | Updated to v3.0


Yes! It’s another update! Today, I’m excited to announce Universal Data Visualization v3.0.
Here’s a brief look at the key changes:
⊕ Added Variables: Integrating variables (Primitives and Tokens) to save time and simplify design management.

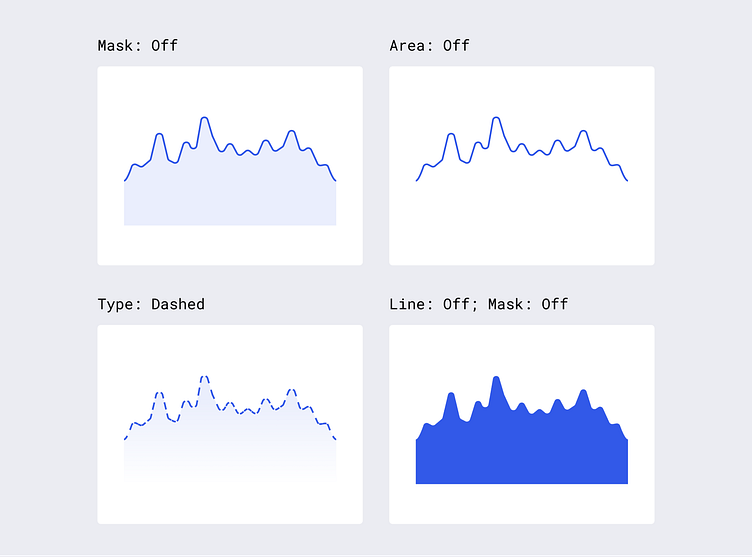
⊕ Enhanced flexibility of the Line Graph component: You can change the line type and manipulate the area.
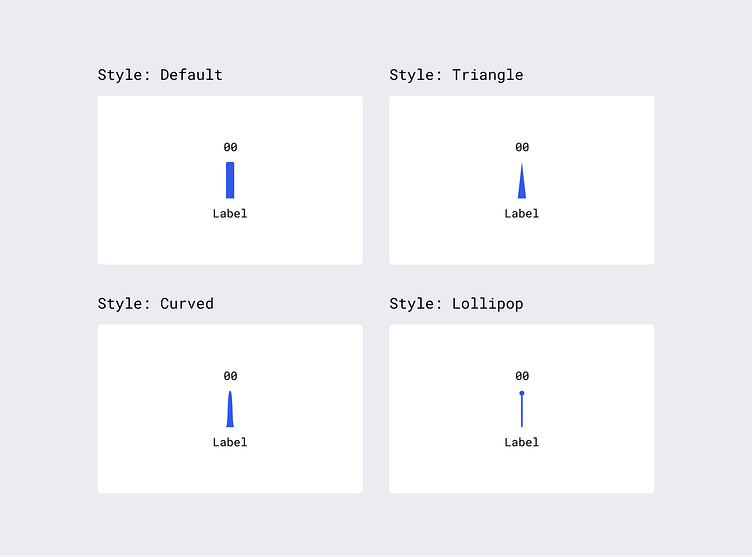
⊕ Enhanced flexibility of the Bar Chart component: You can customize the component style and adjust padding between elements.
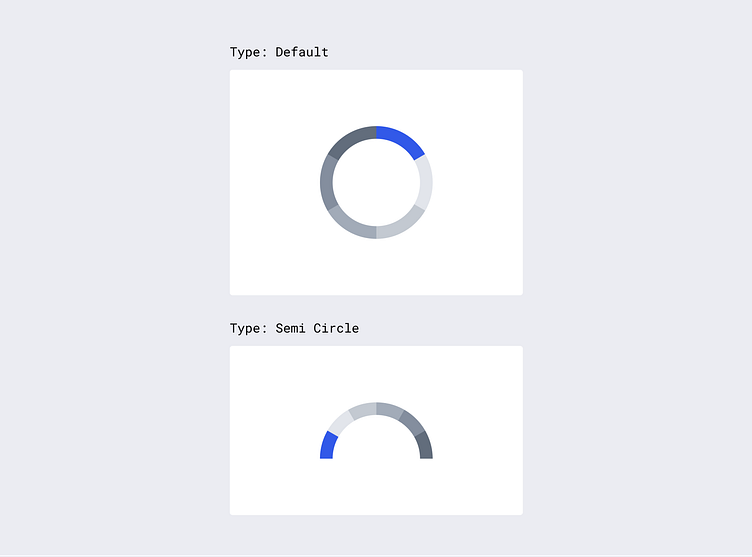
⊕ Introduced the Semi Circle type for the Pie and Donut charts.
Introducing Universal Data Visualization v3.0! Take a closer look and explore it yourself.
→ Explore now
------
Universal Data Visualization is a high-quality tool for creating charts and infographics in Figma. Easy way to visualize your data in seconds.
✓ 9 components and 100+ variants
✓ 200+ ready-made Blocks
✓ 4 pre-made Dashboards


