Stealth - Case Study

Case Study
Company: Stealth (Using "Stealth" for confidentiality)
Year: 2024
* I have made deliberate modifications to certain aspects such as blurs, colors and logo to maintain the confidentiality.
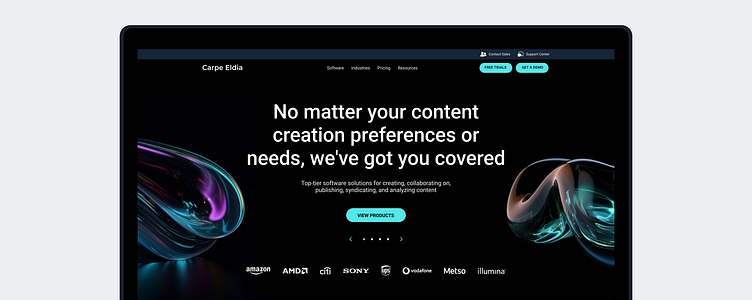
The company is an American software firm that creates authoring tools and solutions for technical writers and documentation teams. The marketing team was seeking solutions to increase the conversion rate on their website and newsletter with the goal of generating more Marketing Qualified Leads (MQLs).
Within this context, the objective of this case study was to propose strategic solutions and underscore the value of a data-driven UX/UI design approach. The goal was not only to enhance the overall user experience but also to drive an improvement in the conversion rate.
The problems
1. Low conversion rate: The existing website struggles to effectively convert visitors into leads or customers
2. Inconsistency in UI elements: Discrepancies in colors, typography, components, and pattern libraries contribute to a disjointed user interface
3. User flow complexity: The user journey is convoluted, potentially leading to frustration and disengagement
4. Lack of communications and collaboration: The team faces challenges in seamless communication and collaboration, impacting the efficiency of design processes
5. Lack of interactions and empathy with users: The website currently lacks genuine interactions and empathetic engagement with its users, hindering a deeper understanding of user needs
Expected outcomes
1. Enhanced conversion rate: Through targeted design adjustments informed by data, we expect a substantial improvement in the website's conversion rate, thereby generating a higher number of Marketing Qualified Leads (MQLs)
2. Consistent UI elements: Through meticulous attention to detail, we anticipate a clean and cohesive UI design, ensuring consistency in colors, typography, components, and pattern libraries. This unified visual identity will contribute to a more polished and professional brand image
3. Improved user flow and navigation: The streamlined integration of data insights will lead to a more intuitive and user-friendly navigation system, reducing complexity and ensuring a seamless user journey
4. Improved collaboration and workflow: By fostering a culture of collaboration and communication centered around data-driven insights, we aim to streamline team workflows and enhance efficiency in design processes. This collaborative approach will lead to smoother coordination among team members, ultimately contributing to the overall success of our digital initiatives
5. Enhanced accessibility to users: Empathy-driven design choices are anticipated to create a positive user experience, establishing a genuine connection between users and the company. This emphasis on user-centric design will not only enhance accessibility but also cultivate a stronger bond between the brand and its audience, emphasizing its commitment to user satisfaction and engagement
The company had tools and resources capable of gathering insightful data, including tools like Lucky Orange, HubSpot and Google Analytics. Additionally, internal teams, such as the sales and customer service teams, were valuable resources with direct user interaction, offering the potential to share profound insights into user needs and pain points. Despite these abundant resources, the company had yet to explore UX strategies aligned with the available data and insights. I intended to bridge this gap by harnessing the untapped potential within their existing tools for a more refined and strategic UX/UI design approach.
To illustrate the concept of a data-driven UX/UI design approach, I initiated the proposal by providing an example to enhance the Vice President of Marketing's understanding, considering her unfamiliarity with UX/UI design. The core idea was to leverage data for identifying user patterns and behaviors, as well as understanding their needs and pain points. This approach involves posing questions such as "Why do we want to make adjustments?" and "What do we expect to achieve from these changes?" when considering modifications, such as altering the placement or color of an element.
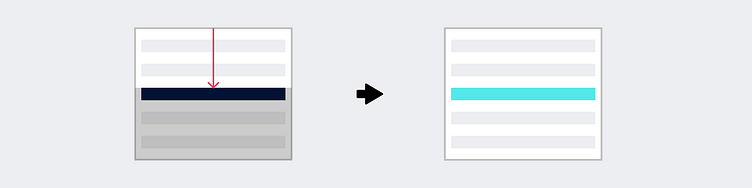
For instance, data extracted from tools like HubSpot, specifically a heat map, revealed that a title bar on the newsletter is obstructing user flow. The issue might be attributed to factors like font size or the color of the title bar. If, for instance, the dark color is disrupting the user flow, we initiate a test using a lighter color to enhance the layout's seamless appearance. Subsequently, we execute A/B testing and make adjustments based on the obtained results. This iterative process ensures that design changes are not arbitrary but grounded in data-driven insights, fostering a more refined and effective UX/UI design approach.

To emphasize the significance of a data-driven UX/UI design approach, I extracted completion rates from Lucky Orange. Across 18 funnels, the average completion rate stood at 0.67%, with the highest being 4%. Specifically, the top-performing funnel revealed that out of 1,582 visitors, only 57 completed the form. This data serves as a compelling indicator that there are substantial opportunities for enhancing the user experience and boosting the potential for Marketing Qualified Leads (MQLs).

The left image is the structure of the company's trial request form, and the right image shows the abandonment report data extracted from Lucky Orange, revealing that 38% of users abandoned the form specifically at the country section.
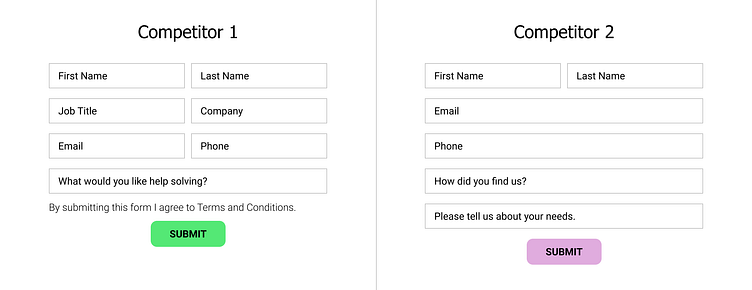
To provide a comprehensive analysis, I investigated the trial request forms of the company's two primary competitors, and both featured forms with fewer mandatory fields for trial or demo requests. In response to these findings, I suggested the simplification of the form. This involves reducing the number of mandatory fields and exploring the option of merging the country section with the phone number section, integrating a country code to capture relevant country information. Additionally, inspired by the streamlined approach of competitor 1, we could consider replacing the checkbox for agreeing to the terms with a concise statement like "By submitting this form, I agree to the terms," thereby minimizing user actions.
This strategic adjustment aims to simplify the user journey and reduce abandonment rates to improve overall user engagement. The anticipated outcome is an enhancement in the conversion rate, as the user experience becomes more intuitive and user-friendly.
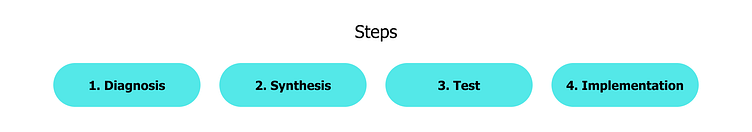
I created a set of four steps to transform the concept into tangible plans for implementing the data-driven UX/UI design approach: 1. Diagnosis, 2. Synthesis, 3. Testing, and 4. Implementation. I set a rough timeline of 2 weeks for each step.
1. Diagnosis
In this initial phase, the focus is on diagnosing the website to pinpoint user needs and pain points, ultimately enhancing the overall user experience. There are various methodologies, including website audit, surveys, user interviews, and leveraging data from tools like Lucky Orange, HubSpot, and Google Analytics.
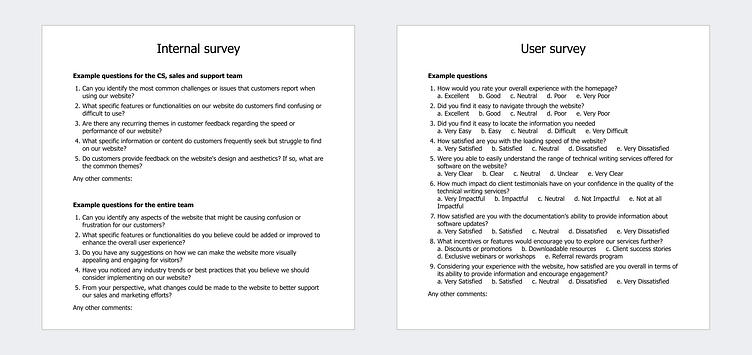
The image above showcases example survey questions that I created. To gather internal insights, I made a set of example survey questions for customer service(CS) and sales and support teams. These teams, with their direct interactions with users, provide valuable insights. Additionally, another set of questions was crafted for all employees, ensuring the collection of inclusive suggestions and feedback.
For user surveys, I've formulated multiple-choice questions to engage a broad audience. Alternatively, incorporating subjective questions with rewards, such as offering discount coupons, can encourage participation and result in more accurate and precise feedback from users. Targeting both existing customers and external visitors unfamiliar with the company ensures a comprehensive understanding and fresh insights into usability.
2. Synthesis
In the synthesis phase, we organize and analyze the extensive data collected through user interviews, surveys, and usability tests. Based on the date from these diverse sources, we then transform raw data into actionable insights. For example, if feedback highlights challenges in completing the trial request form due to its complexity, we streamline the form, prioritizing simplicity and user-friendliness to enhance overall experience. This refinement aims not only to address identified issues but also to boost conversion rates, ensuring a smoother and more efficient user journey.
3. Test
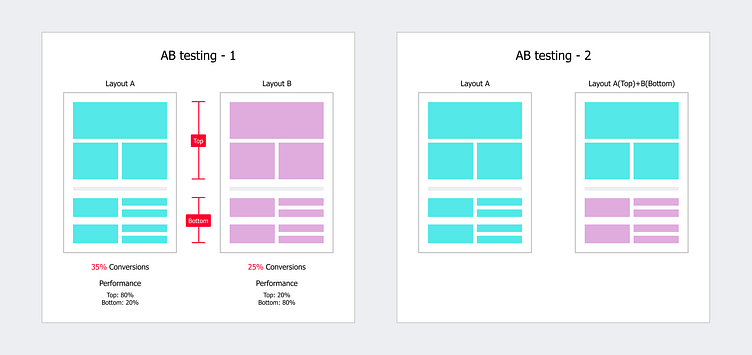
In the testing phase, the process involves crafting hi-fi prototypes and executing A/B testing to validate design enhancement. An example has been prepared, comprising layouts A and B, each featuring two sections: top and bottom. Let's assume that overall, layout A performs better. However, upon closer analysis, it's discovered that the top section of layout A performs better, while the bottom section of layout B excels.
Based on the findings, another round of A/B testing can be initiated. This involves comparing the original Layout A with a hybrid version, integrating the top section from Layout A and the bottom section from Layout B. This iterative testing strategy allows for a more precise understanding of the individual performance of each section, facilitating the refinement of design elements based on specific user preferences and behaviors.
4. Implementation
In the final step, implementation, we make conclusive adjustments based on the insights from the data and testing results. This includes refining the design elements to ensure they align seamlessly with the user experience objectives. We then prepare for the implementation, laying the groundwork for executing the refined design changes effectively and efficiently.
Conclusion:
In conclusion, the proposal for implementing a data-driven UX/UI design approach presents a strategic opportunity for the company to achieve substantial improvements in both conversion rates and user experience. By navigating through the four comprehensive steps - Diagnosis, Synthesis, Testing, and Implementation - the company can formulate targeted design solutions aimed at optimizing user engagement.
The expected outcomes are: firstly, we anticipate a tangible increase in conversion rates as a result of the optimized user experience. By addressing user pain points and refining key design elements based on data-driven insights, we aim to create a more seamless and intuitive user journey, ultimately driving higher rates of conversion.
Secondly, we expect to see a marked improvement in overall user experience, leading to greater user satisfaction and retention. By prioritizing user needs and preferences throughout the design process, we aim to cultivate a positive and engaging user experience that fosters long-term customer loyalty.
In summary, the adoption of a data-driven UX/UI design approach represents a strategic investment in the future success of the company. By leveraging data insights to inform design decisions, we can create a website and newsletters that not only convert more effectively but also delight users with a seamless and intuitive user experience. This, in turn, will position the company for sustained growth and success in the competitive landscape of digital marketing.
Reach out to me!
Email: kiminthepresent@gmail.com
LinkedIn: https://www.linkedin.com/in/kiminthepresent/
Behance: https://behance.net/kiminthepresent


