Data Visualization concepts

Transforming Data into Visual Narratives!
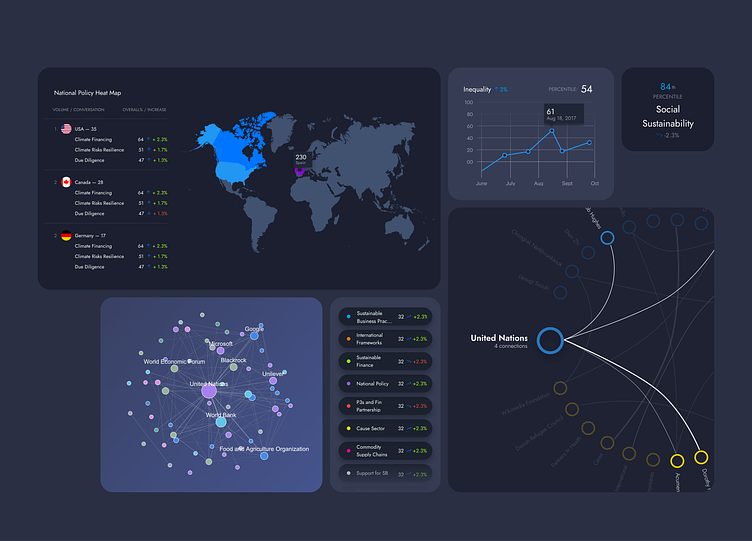
🔍 In a world overflowing with data, presenting information in a clear, engaging, and meaningful way is crucial. With this design, I aimed to turn raw numbers into compelling narratives, unlocking insights and fostering understanding.
🎨 Using a vibrant color palette and intuitive layout, I transformed complex datasets into visually stunning graphics that captivate the eye and stimulate the mind.
✨ Every element was meticulously crafted to enhance comprehension and facilitate exploration, ensuring that users can effortlessly interact with the data and uncover hidden patterns.
💻 From dynamic dashboards to mesmerizing infographics, this design is more than just a feast for the eyes—it's a gateway to a world of possibilities!
🌟 Let's embark on a journey of discovery together—explore the beauty of data visualization and unlock the potential within your datasets! 💪
Visit my Dribbble profile, Website, Behance and Linkedin.


