Fintech App - National Map Data Visualization

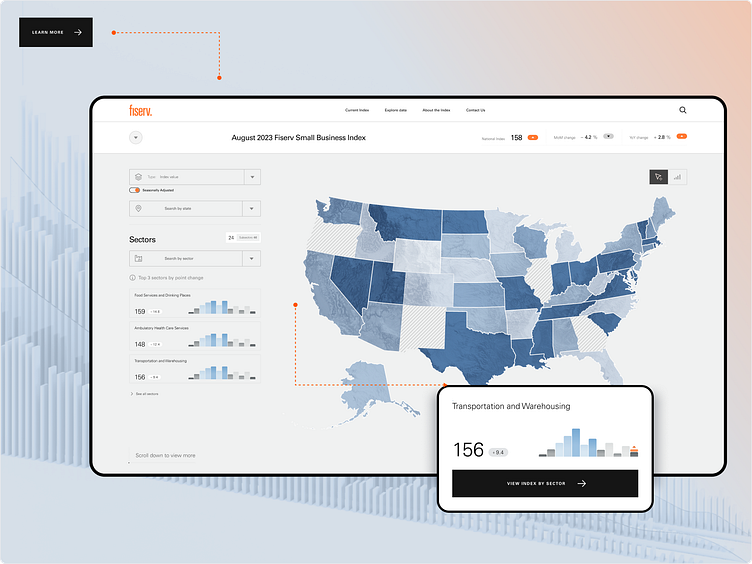
Our state-by-state data visualization is a powerful tool for discerning regional economic dynamics in the fintech sector. The visualization showcasing individual state data provides a nuanced understanding of regional economic health within the fintech industry.
By segmenting the index values by state, such as the detailed metrics for New Mexico, stakeholders can pinpoint local trends, compare sectoral performance, and make informed decisions tailored to each region.

This state-centric approach not only enhances strategic planning but also offers a personalized user experience, reflecting our dedication at Fuselab Creative to delivering precise and impactful UX/UI design solutions.
See the full presentation here; https://www.behance.net/gallery/196066107/Finance-App-Data-Viz-for-Fiserv
Available for new projects!
Social media 🌎: Facebook ⋄ Twitter ⋄ LinkedIn ⋄ Behance
You're always welcome to visit my portfolio.


