Sensor monitoring chart

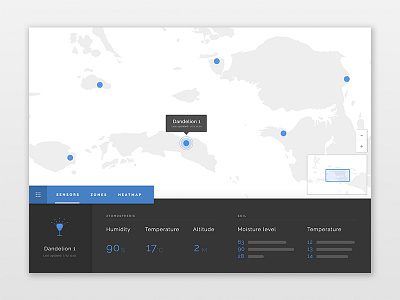

This dashboard presents individual field sensor information of the chosen area. You can manipulate the map, hover/click on sensors, horizontally scroll and browse the metadata.
I'm still playing with the UI, a couple more ideas are on their way!
Check out my adventures outside of design:
Instagram
Twitter


