Stacked Bar Graph

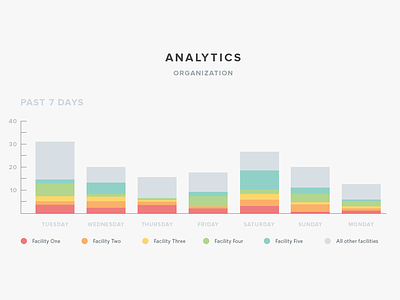
A sample stacked bar data visualization for viewing analytical data. In this case we're examining the use of various healthcare facilities of an organization over the past seven days.
A sample stacked bar data visualization for viewing analytical data. In this case we're examining the use of various healthcare facilities of an organization over the past seven days.


