Line Graph

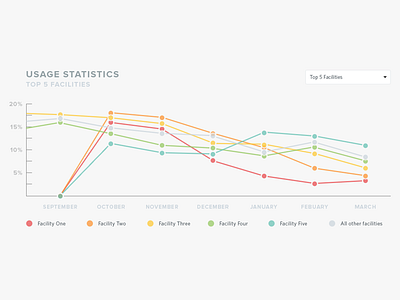
A sample time-base line graph data visualization for viewing analytical data. In this case we're examining the usage statistics of various healthcare facilities of an organization over the past seven days.
A sample time-base line graph data visualization for viewing analytical data. In this case we're examining the usage statistics of various healthcare facilities of an organization over the past seven days.


