Area Graph

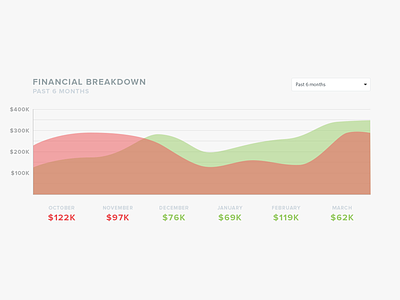
A sample time-base area graph data visualization for viewing financial information. In this case we're examining how a healthcare organization might expense costs as well as see an increase in their revenue from using our product.
This data isn't real, nor is it representative to a particular organization. "Grain of salt."


