I love infographics part 1

I love infographics part 1
Ever since my graduation back in 2012 I've been creating infographics on a regular basis, and I'm always looking to experiment with patterns and styles.
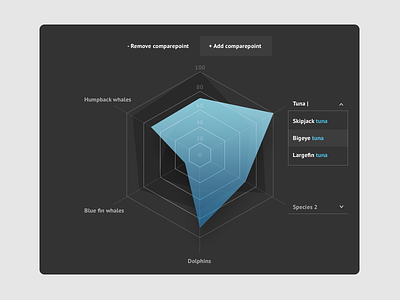
In this part, I've made an interactive spider graph. The user can add points by clicking the button, and can add a category in the next step by searching in the database. This way, the combinations to explore are endless and will always result in a unique shape.
Tell me what you think, or what kind of infographic you would like to see next!


