Data Visualization Chart


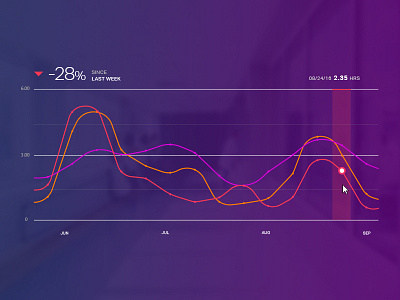
Alternate take for a product focused on displaying multiple streams of high level analytics in the education sphere.
Alternate take for a product focused on displaying multiple streams of high level analytics in the education sphere.


