Visual Data Chart

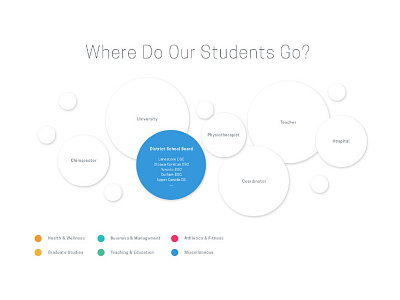
Visual data chart design for Queen's School of Kinesiology and Health Studies. The general idea was to give an in-depth overview of alumni careers. This would showcase choice to prospective students and ignite goals. The data would show that students do not get trapped in one line of work but have a variety of options.
To keep actual numbers private a bubble chart would still reflect the values without giving confidential information away.


