Number and Map Data Visualization

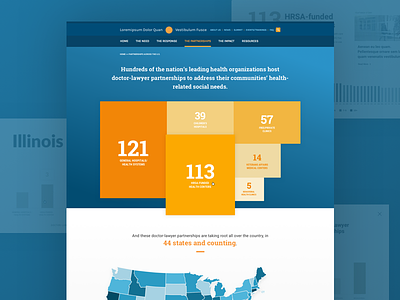


A web design concept showing a way to visualize the same data from two different perspectives: a tile grid structure and a density map.
Enjoy!
A web design concept showing a way to visualize the same data from two different perspectives: a tile grid structure and a density map.
Enjoy!


