Continuous Blood Glucose Monitor - History View


During the design phase of the continuous glucose monitor, we discussed with users what information they wanted to see to help them manage their blood sugar levels. On the history view, we wanted to capture the last 7 valid days of data and display the most important values.
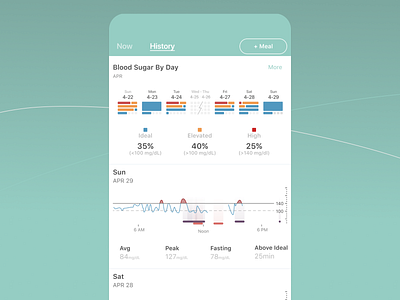
We chose to break this screen down into 3 elements. The top day tracker breaks down each hour of the day and displays if you were in an ideal range, elevated range, or high range. These ranges are set per user when they onboard. Below that, we give a percentage of these values for the entire 7-day range. We show skipped days as well, and group the skipped days that are sequential. The user can hit the more button to see a month worth of data if they'd like.
Below these two elements we display each day’s full graph with food and activity tracked to it with some core values like Average, Peak level, Fasting Level, and time above ideal out. Clicking anyone of these will take the user to an expanded graph view similar to the Today Screen with all of their meal items tracked below.
Check out the attachment to see the full view with all of the graphs on it and make sure to check out the rest of the Continuous Blood Glucose monitor designs. As always, thanks for taking a look.


