Statistics of Tablet Production 💊


Hey Dribbble folks 💫
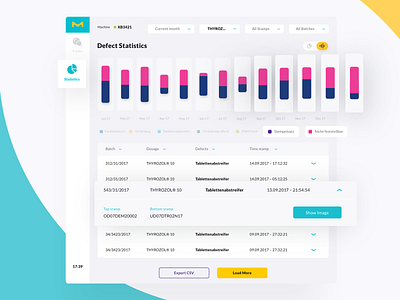
This shot showcases the statistics layer of an app, that tracks for defect tablets during production. Click here for the previous shot!
The user can browse through error statistics and filter them accordingly. The bars will change their colours and shares respective to the applied filters 📊
🧬 Try out the Liquid Design System here. 📺 Watch the trailer on Vimeo!
Thanks for passing by! Now let’s connect: Instagram | Medium


