Daily UI 018: Analytics Chart

Daily UI 018: Analytics Chart
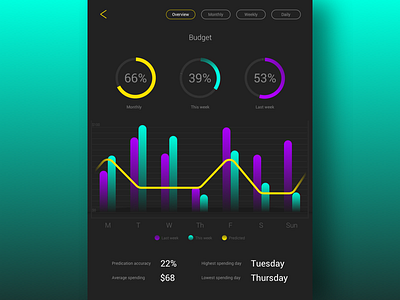
Here we have an unnamed brand's spending app. We have both a bar graph giving the overall information, a line graph showing predicted spending habits, and pie charts showcasing spending in regards to the respective budget label. Built for the dimension of an iPad.
Created in Sketch.
See more at: www.danieferrusi.net/dailyui


