📊 Visual Edits

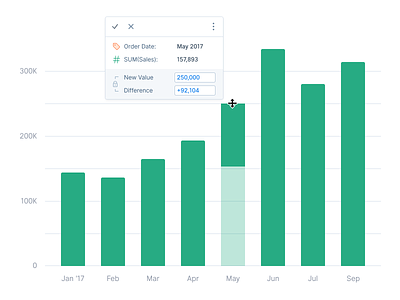
Making some progress with Anasen. This is a small preview to show you how you could visually update the values of a chart with a simple drag and drop.
Being able to play with a big set of data and creating hypothesis of multiple scenarios are essential to many people. I've seen the product, and all I can say it's gonna very huge! No need to code with your database to get the expected results, Anasen can help you in the most easiest way possible.
The big promise of this software is to be able to interact directly from the chart without needing to query your all base wich is not accessible for everyone.


