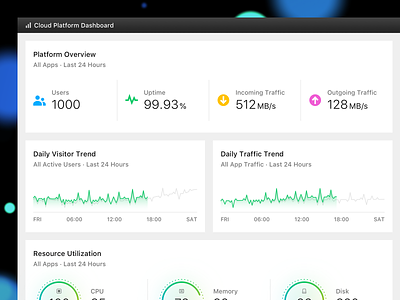
3D Cloud Monitoring Dashboard


A dark themed dashboard I've been working on.
You can see an interactive 3D topography graph on the right. Each layer represents a specific plane in the infrastructure (i.e., ingress → nodes → apps → containers).
dashboard_en.png
2 MB