Visualizing Application Infrastructure
Data Visualization
—
On the virtual infrastructure team, our users might get a call from developers asking, “Why is my app slow?” Our users could be monitoring thousands of objects and any one of them could be responsible for the issue. They use our tools to look for alerts, and try to make sense of them.
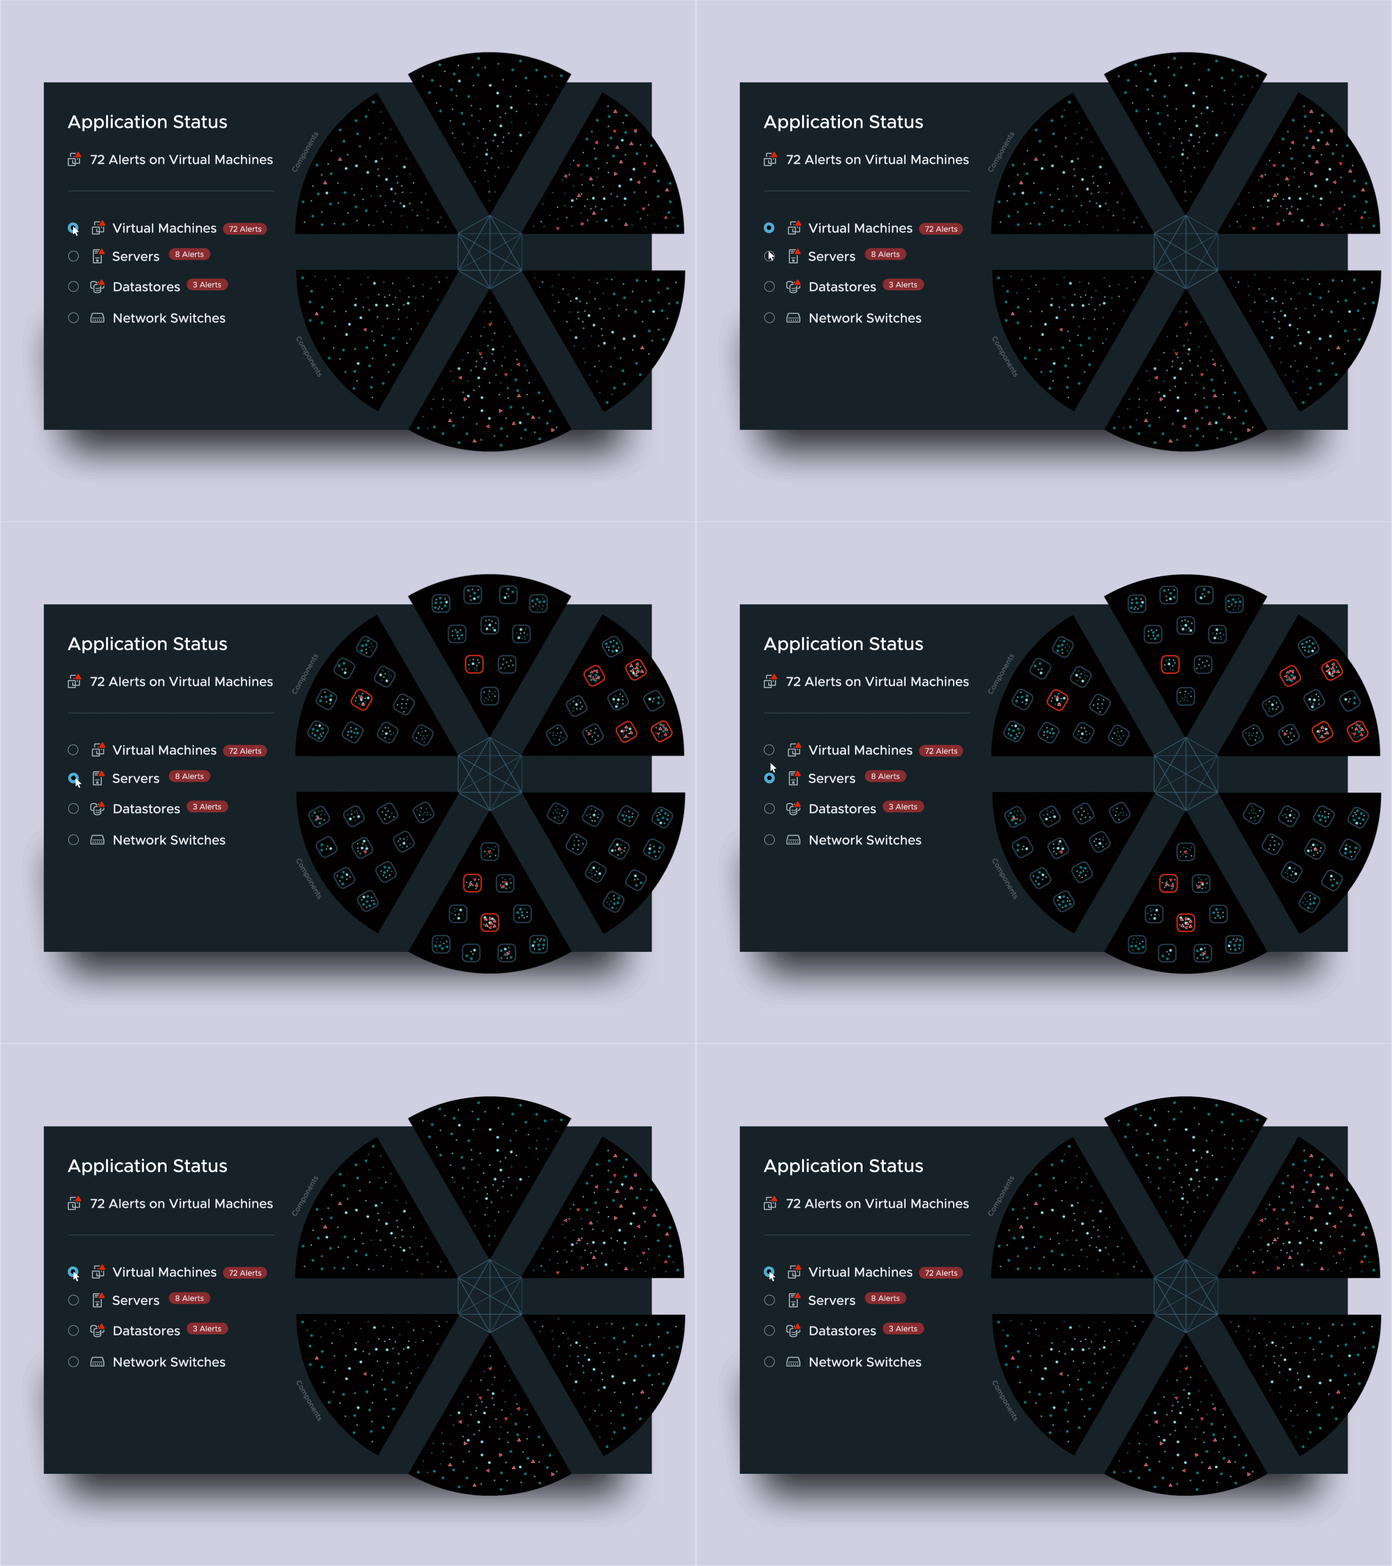
On a bad day, the virtual infrastructure team might get pinged with a flood of alerts, currently visualized in data-grids. On these bad days, data-grids are especially painful. We’re figuring out how to visualize patterns in infrastructure alerts to help users quickly troubleshoot.
As there could be as many infrastructure objects as stars in the sky, we’ve explored visualizing infrastructure objects as constellations.
—
Created with Nick Bewley


