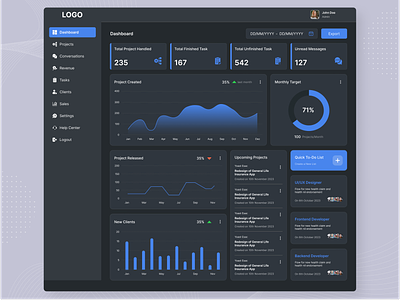
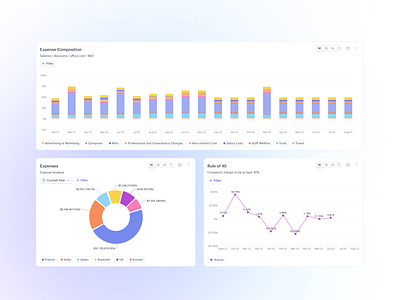
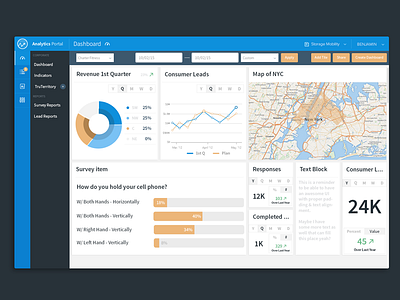
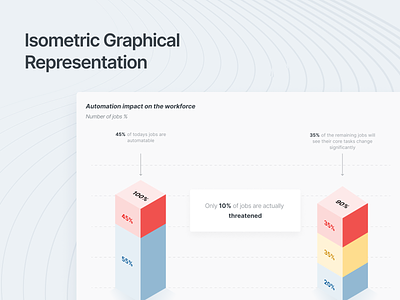
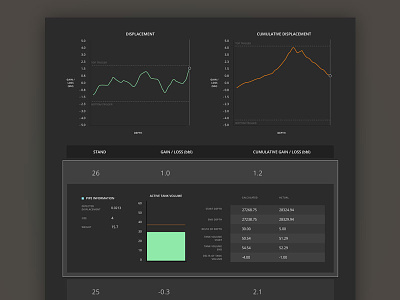
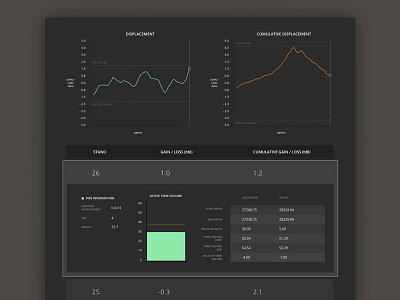
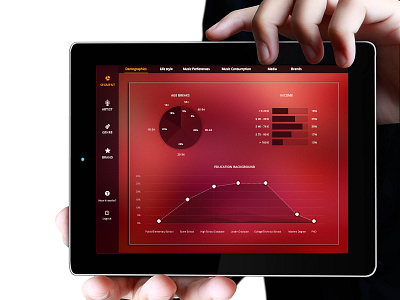
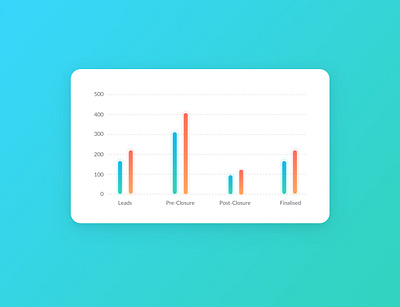
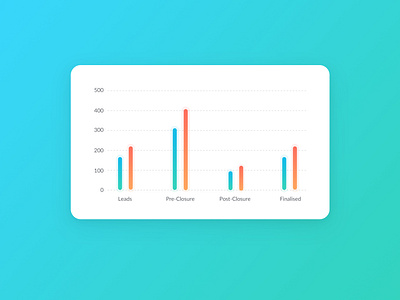
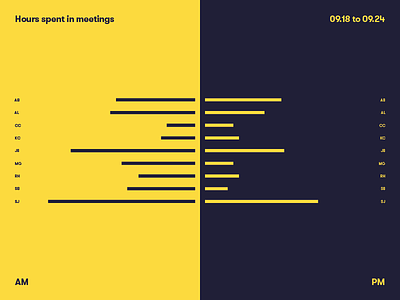
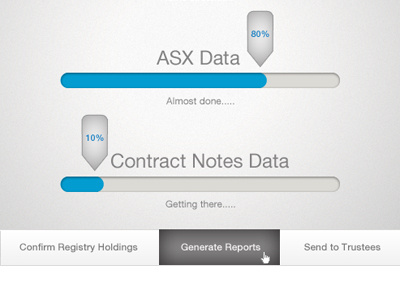
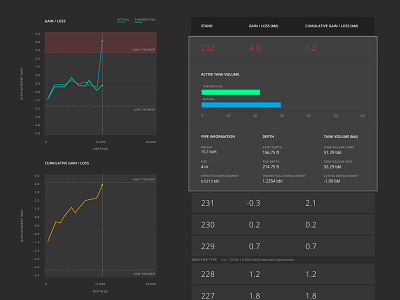
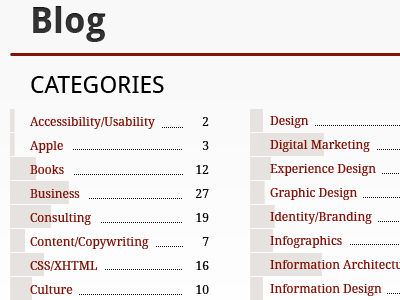
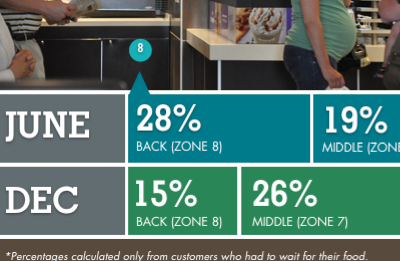
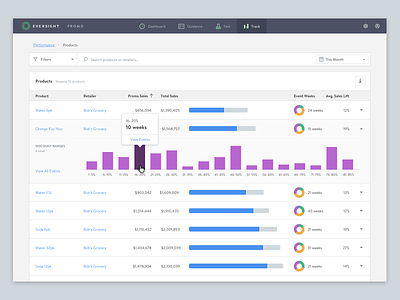
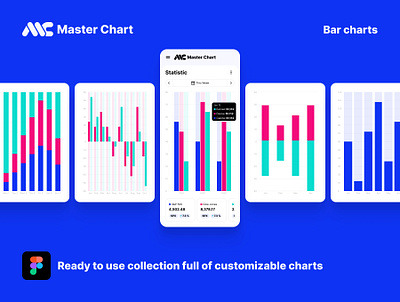
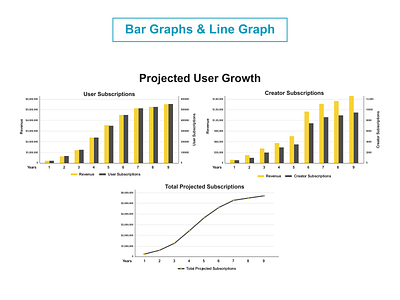
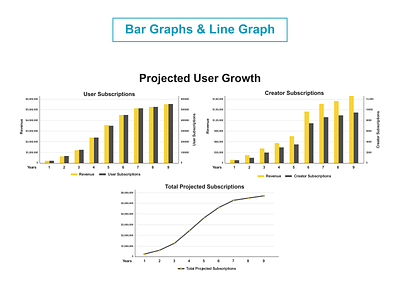
Bar Graphs

Inspirational designs, illustrations, and graphic elements from the world’s best designers.
Want more inspiration? Browse our search results...

  1. Project Management Portal | SaaS Application bar graphs charts dark dashboard dark theme dark theme dashboard dashboard dashboard tiles dashboard ui doughnut chart filters line graph project dashboard project management side navigation task management task management dahsboard timeline chart updated web application web portal
    View Project Management Portal | SaaS Application
    Project Management Portal | SaaS Application
    7
    6.9k
  2. Data Visualisation | Drivetrain b2b bar graphs chart colors charts components dashboard data data visualisation design system drivetrain fintech graphs line graph pie chart saas table ui design visualisation
    View Data Visualisation | Drivetrain
    Data Visualisation | Drivetrain
    7
    4.9k
  3. Analytics Dashboard | Web App analytics app navigation bar graphs dashboard graphs pie chart tiles web app web app dashboard
    View Analytics Dashboard | Web App
    Analytics Dashboard | Web App
    24
    7.6k
  4. Isometric graphical representation for toolkit website 3d bar graphs design graphs isometric ui uidesign uiux
    View Isometric graphical representation for toolkit website
    Isometric graphical representation for toolkit website
    9
    1.4k
  5. Data Dashboard bar graphs dark ui dashboard data visualization graphs line graphs tables
    View Data Dashboard
    Data Dashboard
    17
    5.8k
  6. Reorder Bars on Bar Graphs bar graphs data drag and drop graphs organize rearrange reorder reporting ui ux
    View Reorder Bars on Bar Graphs
    Reorder Bars on Bar Graphs
    37
    14.5k
  7. Converting icons to bar graphs animated bar graphs data viz graphs icons minimal motion typography weather web app
    View Converting icons to bar graphs
    Converting icons to bar graphs
    31
    5.7k
  8. Designing in Figma bar graphs figma graphs house icons map shelter ui uidesign visualization
    View Designing in Figma
    Designing in Figma
    16
    1.7k
  9. Development Management Tool bar graphs dashboard data visualization development gantt chart graphs gui line graphs management metrics project management
    View Development Management Tool
    Development Management Tool
    50
    13.5k
  10. Small multiples apercu bar graphs data small multiples typography vibrant visualization viz
    View Small multiples
    Small multiples
    16
    2.5k
  11. Analytics analytics bar graphs data insights line charts pie graphs table ui
    View Analytics
    Analytics
    20
    2.9k
  12. Demographics bar graphs graphs infographics microsite pie chart ui ux ux ui visual design website
    View Demographics
    Demographics
    21
    3.6k
  13. Simple Bar Graph analytics app bar graphs colors dashboard app design graphic graphs icons illustration minimal minimalism minimalist design minimalistic modern modernism ux vinodkumarpalli
    View Simple Bar Graph
    Simple Bar Graph
    7
    1.1k
  14. Ecommerce Report bar graphs dashboard graphs icons interface numbers stats tabs ui
    View Ecommerce Report
    Ecommerce Report
    55
    5.7k
  15. Hours Spent in Meetings bar graphs data data visualization meetings
    View Hours Spent in Meetings
    Hours Spent in Meetings
    28
    1.7k
  16. Little loading bar graphs bar graphs loading
    View Little loading bar graphs
    Little loading bar graphs
    5
    1.1k
  17. Infographic Love II bar graphs charts data editorial illustration infographic line graph pie charts
    View Infographic Love II
    Infographic Love II
    4
    1k
  18. Dashboard alert system bar graphs dark ui dashboard data visualization graphs line graphs tables
    View Dashboard alert system
    Dashboard alert system
    16
    5.8k
  19. Analytics Dashboard bar graphs circle graphs dark dashboard dashboard graph design insights dashboard ui
    View Analytics Dashboard
    Analytics Dashboard
    16
    3.7k
  20. Data-viz for category listings bar graphs blog categories data viz droid sans droid serif red
    View Data-viz for category listings
    Data-viz for category listings
    9
    1.7k
  21. Bar graphs bar graphs data infographics information design percentages
    View Bar graphs
    Bar graphs
    3
    1.3k
  22. Performance Table app bar graphs charts design graphs interface pie charts tables tooltips ui web
    View Performance Table
    Performance Table
    79
    60.7k
  23. Bar charts components for Figma mobile app template app bar bar chart bar charts bar graph bar graphs blue chart chart kit charts components data visualisation figma figma kit minimal mobile redesign template tool tip ui design
    View Bar charts components for Figma mobile app template
    Bar charts components for Figma mobile app template
    0
    1.2k
  24. Bar Graphs & Line Graphs Collection adobe illustrator adobe photoshop bar graphs branding design graphs collections illustration infographic infographic design line graphs minimal
    View Bar Graphs & Line Graphs Collection
    Bar Graphs & Line Graphs Collection
    0
    2.5k
Loading more…