Streamer Dashboard

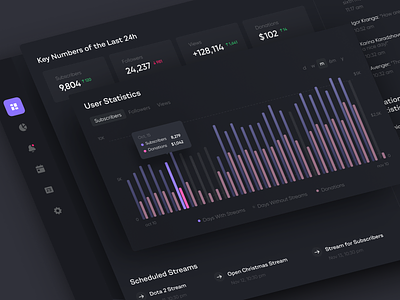
We live for clean UI in apps that analyze statistics. There are several rules for building graphs in them: 1. Delete. Unnecessary. Stuff. OK? 2. Use the maximum of the graph space. That is, you need to arrange data tightly, and compactly. 3. The concept of a lie factor: you need to portray data objectively. Don’t use hyperbolizing graphics, and give honest statistics.
Let's collaborate!
hi@conceptzilla.com
Discover more about us at conceptzilla.com


