Website Users vs Bookings and Revenue Dashboard

This is a condensed version of an automated weekly report for the board of directors.
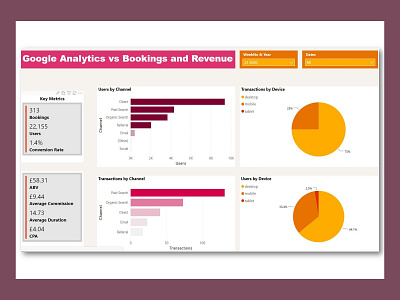
It is a dynamic, interactive dashboard showcasing the weekly web traffic resulting in bookings and revenue by device.
Data source is Google Analytics for the user and transactions info and SQL for the bookings and revenue data.
Let me know what you think.


