Motley Fool Scorecards
4
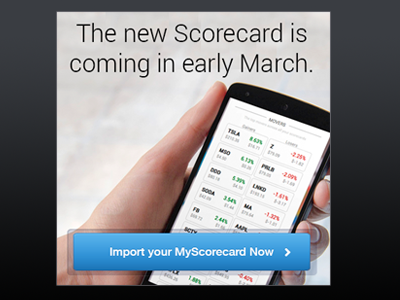
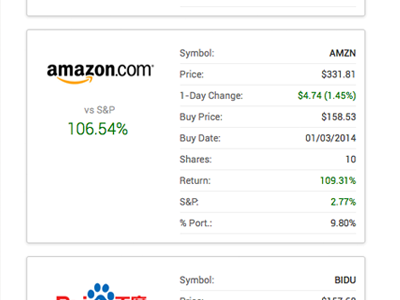
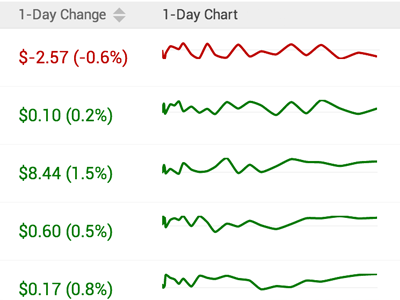
Track all of your investments from stocks and mutual funds from any brokerage, both open and closed paired with our get Foolish insights.
More Projects


4
Track all of your investments from stocks and mutual funds from any brokerage, both open and closed paired with our get Foolish insights.


