The visualization and analysis of data from mobile operators

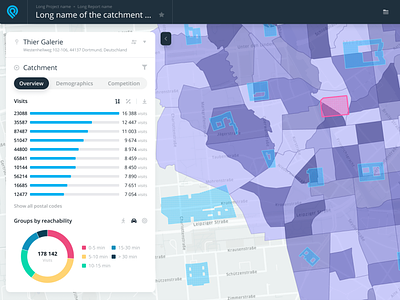


The Flexatel team works regularly on a wide range of projects that visualize and analyze data from mobile operators. Data analysis and visualization is one of today’s most promising fields, bringing together geographic information systems and big data analysis tools. Central to visualization challenges is effectively displaying information on maps and graphs to facilitate analysis. Maps display availability zones, visitor traffic, and sets of different filters. Additional data can be presented in pop-up windows and on the dashboard system, providing the user with the tools to assess business location suitability based on geographic data.
Looking forward to your feedback!
Our website


