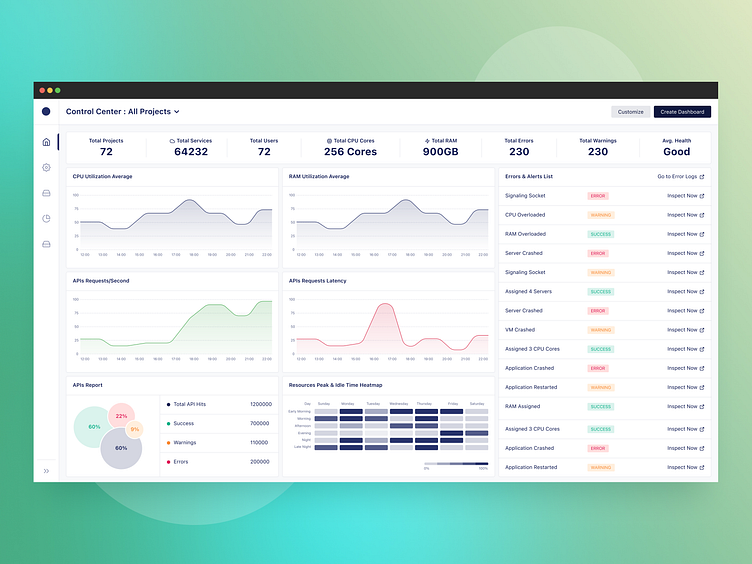
Interactive Dashboard for CloudOps SaaS

Press the 'L' button to show some love.
What was the purpose of the project?
So this dashboard was designed for a startup founded by an investor & CEO of a B series funded customer support startup to jump into cloudOps domain. And he ask me to do research on competitors, developers & engineering managers to create an interactive dashboard that can be helpful to show plenty of cloud infra data in visual format along with the flexibility to interact with it in the form of events like drag & drop, create, read, save, update, delete (CRUD) operations.
What was done
Research
(User, Stakeholder & Competitive)
UX/UI design (HiFi & LoFi, Animations, Prototypes)
Design System
Designer < -- > Developer Collaboration
Testing (UI Test, UX Test, User Acceptance Testing)
What tools did we use?
Figma
⭐️ ⭐️ ⭐️
Interesting project to discuss? Shoot a mail us now
💌 dharmaramprajapatt@gmail.com
Want to see more in the future? Don't miss any of our shots and follow us on Dribbble & Behance
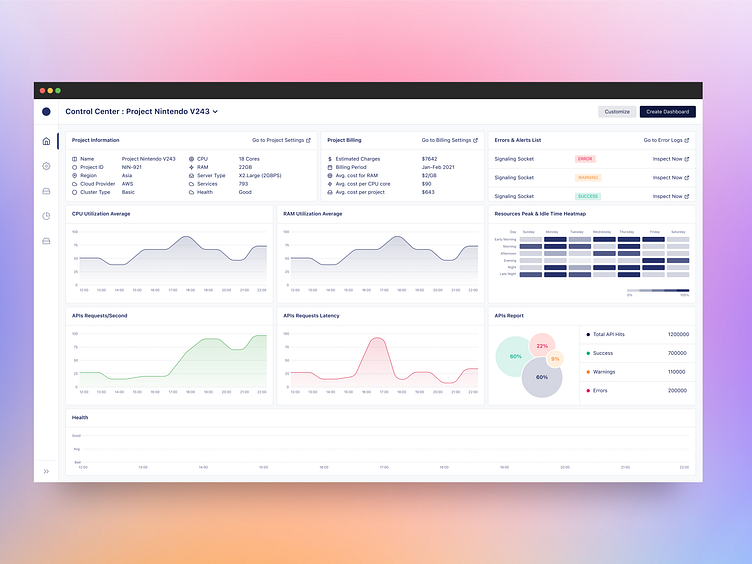
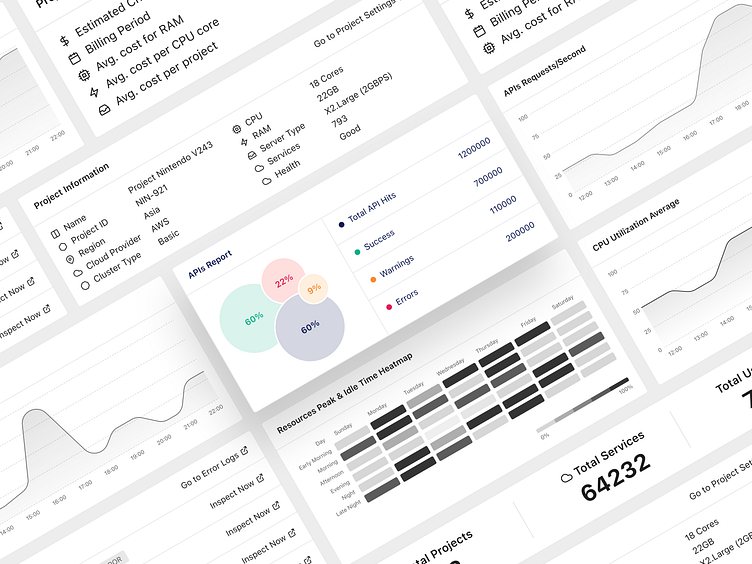
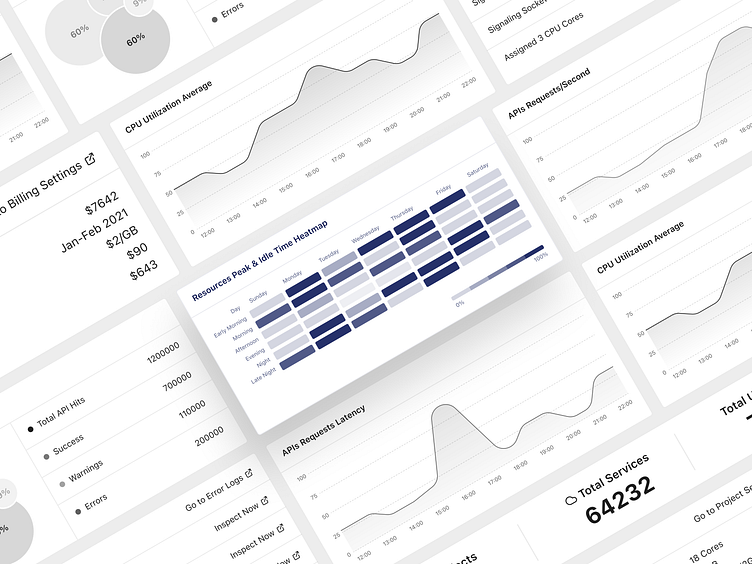
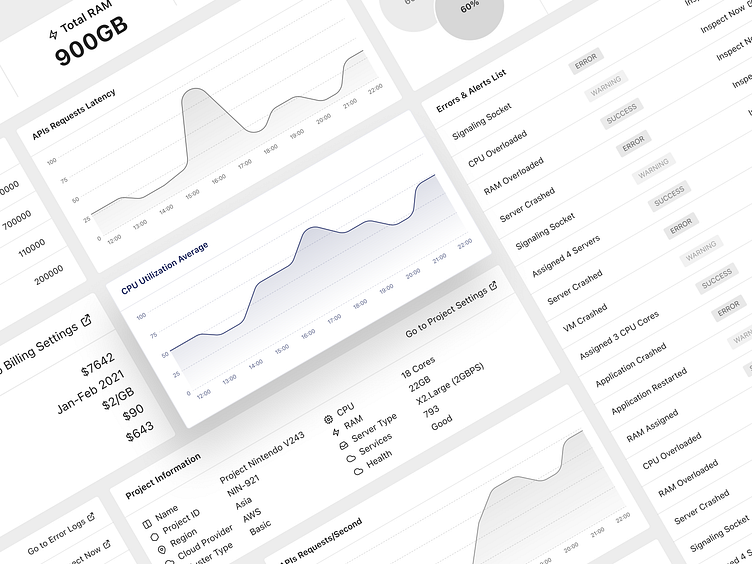
Dashboard UI Cards
All these cards were drag & drop so a developer, devOps manager, engineering manager & CTOs can create their own version of dashboard. So everything is interactive here.